Figure 1.
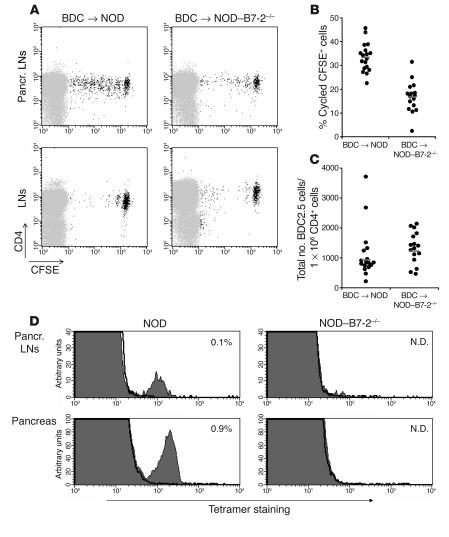
B7-2 deficiency alters the initial activation of diabetogenic T cells. (A) We sorted BDC2.5 T cells, labeled them with CFSE, and transferred 1 × 10⁶ cells into NOD (left panels) or NOD_B7-2_/_ (right panels) recipients. After 2 weeks, we examined BDC2.5 T cell proliferation in pancreatic LNs (top panels) and peripheral LNs (bottom panels). Similar results were observed in peripheral LNs and spleen (data not shown). A representative experiment is shown. Pancr., pancreatic. (B) The results of 5 separate experiments performed as described in A are shown. We expressed the results as the percentage of cycled CFSE+ cells in the pancreatic LNs calculated as: (number of cycled CFSE+ cells/total number of cycled and noncycled CFSE+ cells) × 100. Each circle represents an individual mouse. Horizontal bars represent the mean value for each group. (C) We compared the total number of BDC2.5 CFSE+ cells (normalized to the number of endogenous CD4+ cells) recovered in the pancreatic LNs in NOD (n = 17) and NOD_B7-2_/_ (n = 16) recipients. Each circle represents an individual mouse. Horizontal bars represent the geometric mean. There was no statistical difference in the total number of BDC2.5 cells in the pancreatic LNs in NOD and NOD_B7-2_/_ mice (t test using geometric mean, P > 0.05). Similar results were observed in peripheral LNs (data not shown). (D) Single-cell suspensions from pancreatic LNs and pancreas of 16- to 18-week-old NOD and NOD_B7-2_/_ mice were stained with CD8 and NRP-V7-H-2Kd tetramers. Results display NRP-V7-H-2Kd tetramer (filled histogram) and TUM-H-2Kd control tetramer (bold line) staining. The percentage of CD8+ tetramer+ cells within the mononuclear cell population was indicated. N.D., not detected.

