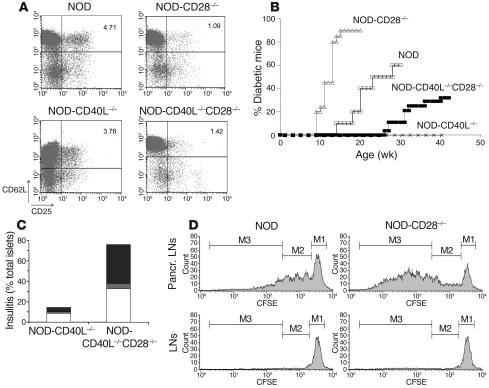
Figure 5.
CD28 and CD40L differentially affect diabetes in NOD mice. (A) We developed NOD mice deficient for CD28 (NOD-CD28_/_), CD40L (NOD-CD40L_/_), or both CD40L and CD28 (NOD-CD40L_/_CD28_/_). We compared the number of Treg’s in these different strains. The results are displayed as CD62L (y axis) versus CD25 (x axis) staining and are gated on the CD4+ population. One out of 3 representative experiments is shown. (B) We compared the incidence of diabetes in NOD (open squares), NOD-CD28_/_ (open triangles), NOD-CD40L_/_ (x’s) and NOD-CD40L_/_CD28_/_ (filled squares) mice. (C) We performed histological analysis of the pancreas in NOD-CD40L_/_ and NOD-CD40L_/_CD28_/_ mice and scored the severity of insulitis as peri-insulitis (white bars), moderate insulitis (gray bars) and severe insulitis (black bars) in NOD-CD40L_/_ and NOD-CD40L_/_CD28_/_ mice (70 and 37 islets were scored, respectively). (D) CD25-depleted BDC2.5-CD90.1 T cells were labeled with CFSE and transferred into NOD or NOD-CD28_/_ mice. Four days later, the proliferation of BDC2.5 cells was assessed in the pancreatic LNs. The histograms are gated on CD4+ CD90.1+ cells, and the 3 regions M1_M3 indicate undivided cells, cells that underwent 1 to 3 divisions, and cells that underwent 4 or more divisions, respectively.

