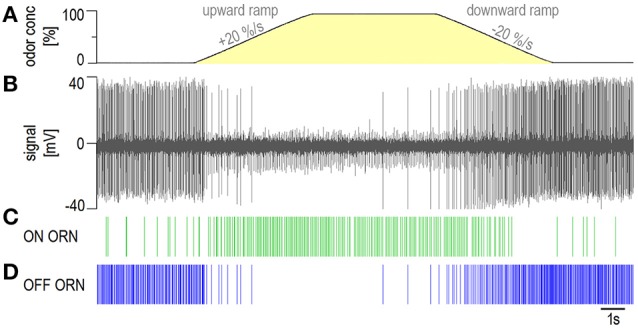
Figure 1.

Example of the activity of an ON and an OFF ORN in the same sensillum during a ramp-like upward concentration change of +20%/s followed by a ramp-like downward concentration change of −20%/s of the odor of lemon oil. (A) Yellow region shows time course of odor concentration measured by flow meter. (B) extracellularly recorded activity; the OFF ORN displayed larger impulse amplitudes than the ON ORN. (C,D) responses of both types of ORNs represented in raster plots. Spike identification was performed offline using the software Spike 2.
