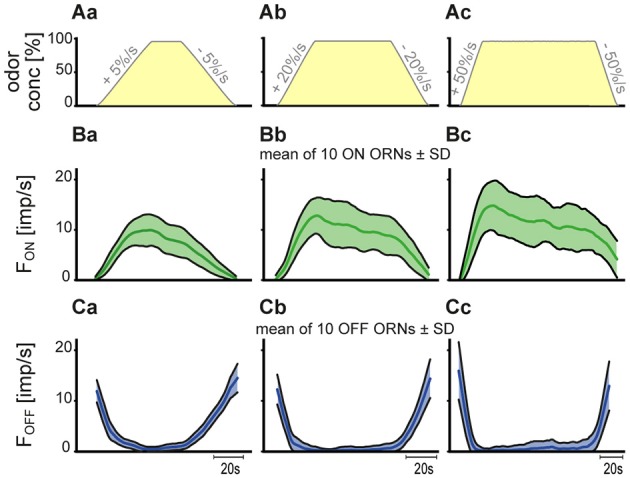
Figure 5.

(A–C) Time course of pooled responses of 10 pairs of ON and OFF ORNs from the same sensilla to three ramp-like upward and downward concentration changes. (A) time course of the three upward and downward concentration ramps. (B,C) mean response functions providing a group estimate of the time course of response. Shaded bands illustrate standard deviations of responses from the mean response function. Bin widths for impulse counts were 0.5 s for 5%/s ramps, 0.2 s for 20%/s ramps, and 0.1 s for 50%/s ramps.
