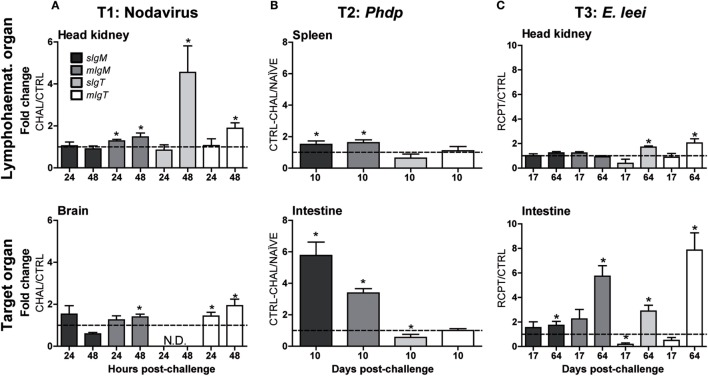
Figure 5.
The different Ig isotypes are differentially regulated upon challenge with different pathogens. Normalized gene expression analysis of soluble and membrane IgM and IgT in gilthead sea bream challenged with a virus (A) [T1: CTRL vs. challenged (CHAL)], a bacterium (B) (T2: NAÏVE vs. CTRL-CHAL), or a parasite (C) (T3: CTRL vs. RCPT). The analysis was performed on a lymphohematopoietic organ [head kidney (A,C) and spleen (B)] and a target organ for the pathogen [brain (A) and intestine (B,C)]. The gene expression was calculated using the β-actin as a reference gene and the expression in non-challenged fish (dotted line at y = 1) to calculate the fold changes. Values represent the mean + SE of n = 5–6 (A), n = 3–5 (B), and n = 5–9 (C). Asterisks (*) represent significant differences with the non-challenged group at p < 0.05. N.D. stands for not detected.

