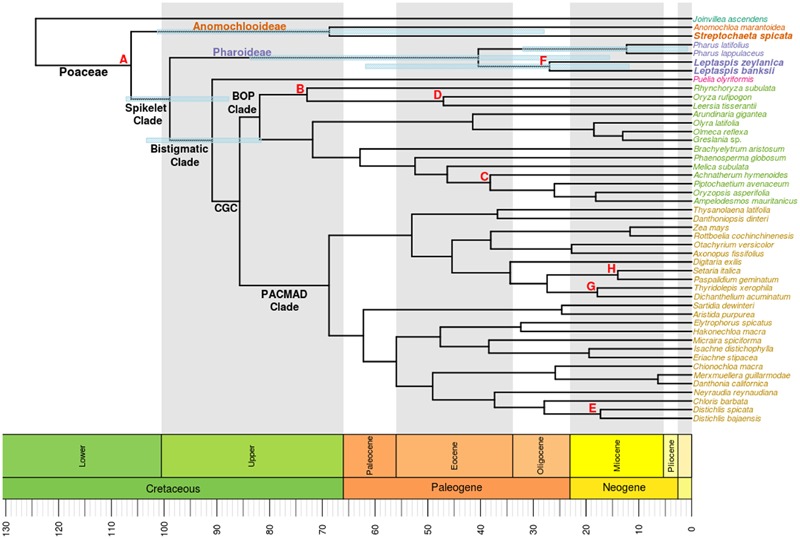
FIGURE 2.

Chronogram determined from divergence date estimation analysis using the complete plastome and the same species included in the tree of Figure 1. Branch lengths are proportional to the amount of time since divergence, as indicated on the scale at the bottom of the figure. Fossil calibration nodes are represented with letters (Table 1). Bars illustrate the 95% highest posterior density (HPD) interval for clades of interest. Newly sequenced taxa are in bold.
