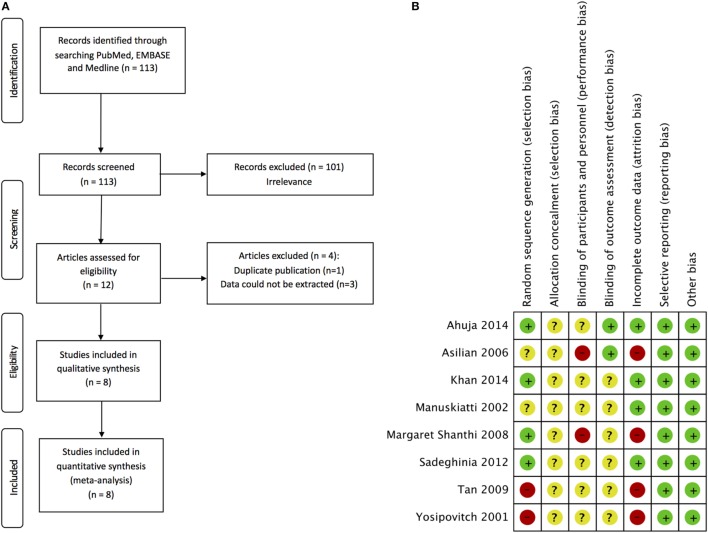
Figure 1.
Schematic representation of the search strategy and risk of bias summary of selected studies. (A) Flow chart showing the selection process of the studies in the meta-analysis. (B) review authors’ judgments about each risk of bias item for each included study. +, low risk; −, high risk; ?, unclear risk.

