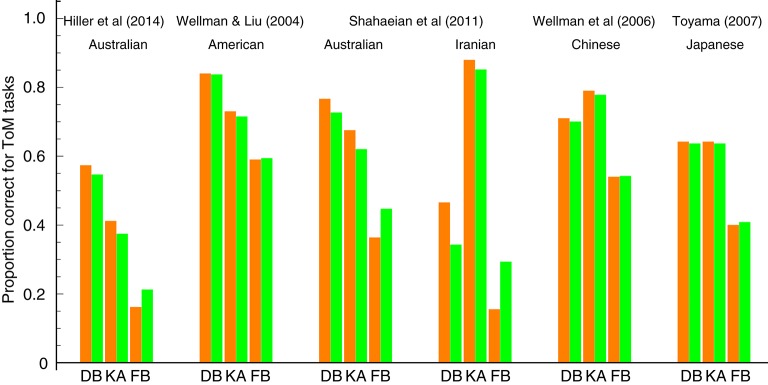
Figure 2.
Comparisons between our model prediction and behavioral ToM scale data for three tasks: diverse beliefs (DB), knowledge access (KA), and false beliefs (FB). Orange bars represent the behavioral data. Green bars represent the fits of our prediction (the estimated values of the parameters πB, πV, and πFB). The left part of the figure depicts the results for Western children (Australian and American); the right part for Asian/Middle Eastern children (Iranian, Chinese, and Japanese).

