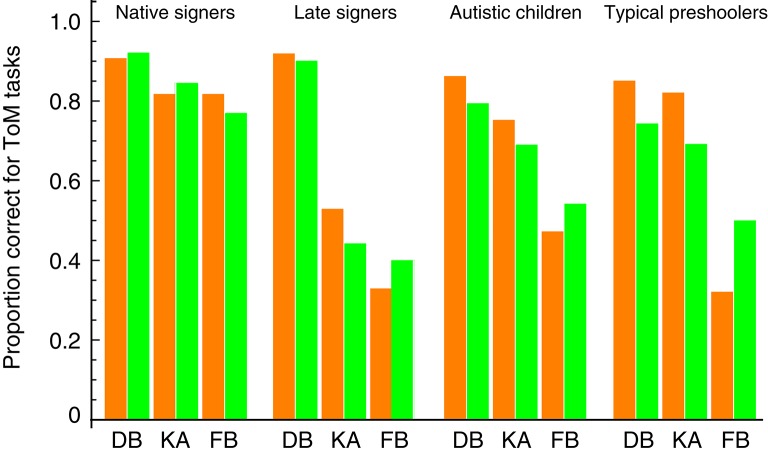
Figure 4.
Comparison between our model prediction and the ToM scale data of children with and without developmental delays in Peterson et al. (2005). DB, diverse beliefs; KA, knowledge access; FB, false beliefs. Orange bars represent the behavioral data. Green bars represent the fits of our prediction (the estimated values of the parameters πB, πV, and πFB).

