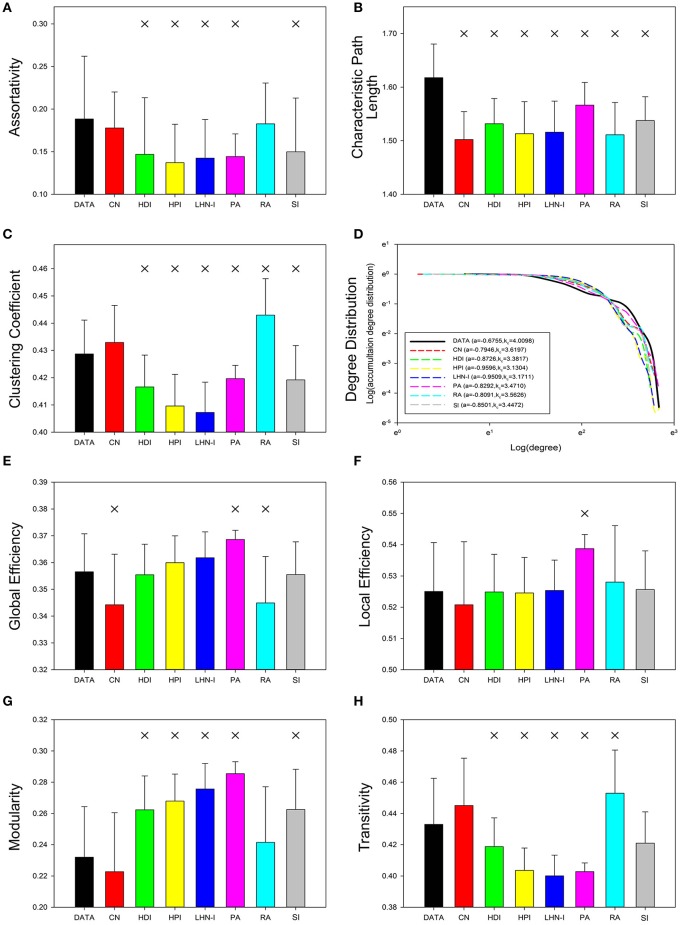
Figure 3.
Topological properties of real data and predicted networks. Error bars show standard deviation. Asterisks indicate a significant difference between real data and the predicted networks (p < 0.05, FDR corrected for 7 comparisons). The statistical test method was a two-sample paired nonparametric test and the corrected method was Benjamini and Hochberg false-discovery rate method (q = 0.05). The illustration of degree distribution was on the sparsity of 15%. CN, common neighbor; HDI, hub depressed index; HDI, hub promoted index; LHN-I, Leicht-Holme-Newman index; SI, Sørensen index; PA, preferential attachment index; RA, resource allocation index.

