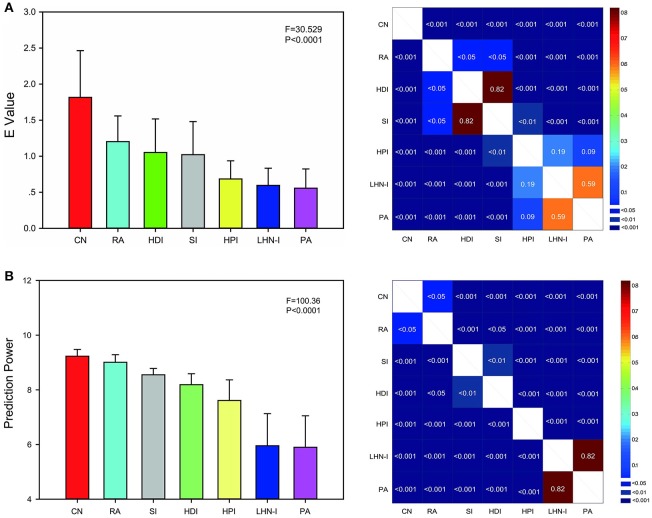
Figure 4.
E value and prediction power comparison among local information indices. (A) The E-value was used to evaluate the predictions comprehensively. Local information indices were sorted by E-value. (B) Prediction power was a rapid evaluation metric. Local information indices were sorted by prediction power. Both the evaluation methods showed the similar results that common neighbor showed the best predicted effect and preferential attachment index showed the worst in seven selected local information indexes. Error bars show standard deviation. The F-value and P-value was the result of one-way ANOVA analysis (uncorrected). The right illustration was the P-value of two-sample paired T-test between any two indices (FDR corrected for 21 comparisons, q = 0.05). CN, common neighbor; HDI, hub depressed index; HDI, hub promoted index; LHN-I, Leicht-Holme-Newman index; SI, Sørensen index; PA, preferential attachment index; RA, resource allocation index.

