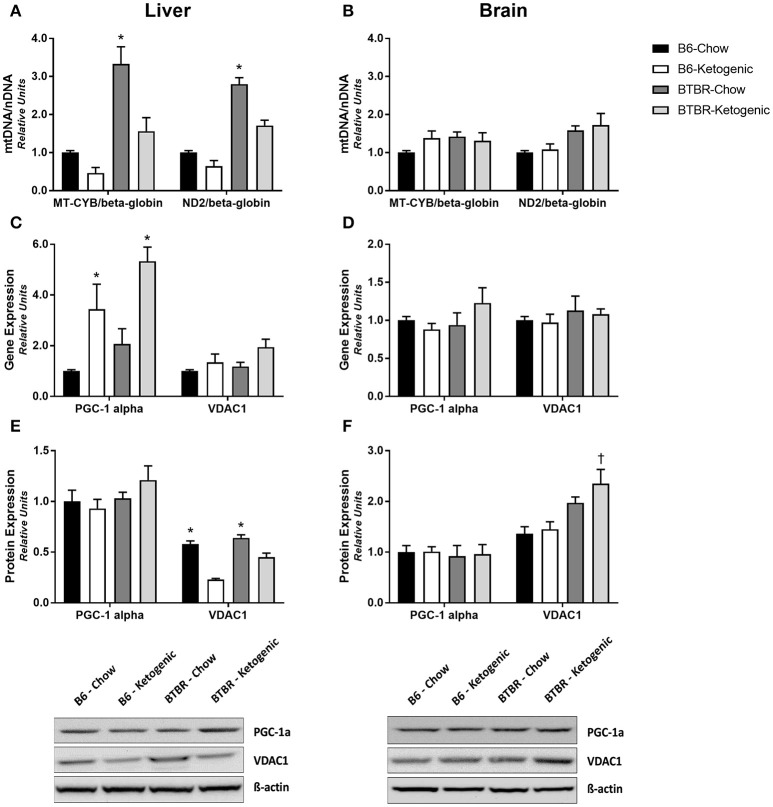
Figure 4.
Evaluation of mitochondrial gene and protein expression to infer regulation of mitochondrial abundance and biogenesis. Liver and brain tissues were analyzed to measure the mtDNA/nDNA ratios for the mitochondrial genome-encoded cytochrome b (MT-CYB) and NADH dehydrogenase 2 (ND2), expressed relative to the nuclear-encoded β-globin. (A) mtDNA/nDNA ratio measured from liver. (B) mtDNA/nDNA ratio measured from brain. Liver and brain tissues were also analyzed for gene and protein expression of the mitochondrial biogenesis regulator—peroxisome proliferator-activated receptor-γ coactivator 1-α (PGC-1α) and the marker of mitochondrial abundance—voltage-dependent anion-selective channel 1 (VDAC1). (C) Gene expression of PGC-1α and VDAC1 measured in liver. (D) Gene expression of PGC-1α and VDAC1 measured in brain. (E) Protein expression of PGC-1α and VDAC1 measured in liver. (F) Protein expression of PGC-1α and VDAC1 measured in brain. All qRT-PCR data were collected with β-Actin as a loading control and are presented as mean ± SEM (B6-Chow, B6-Ketogenic, BTBR-Chow, and BTBR-Ketogenic; n = 8 for each). *Indicates a difference compared to all other groups at p < 0.05. †Indicates a difference due to genotype at p < 0.05.

