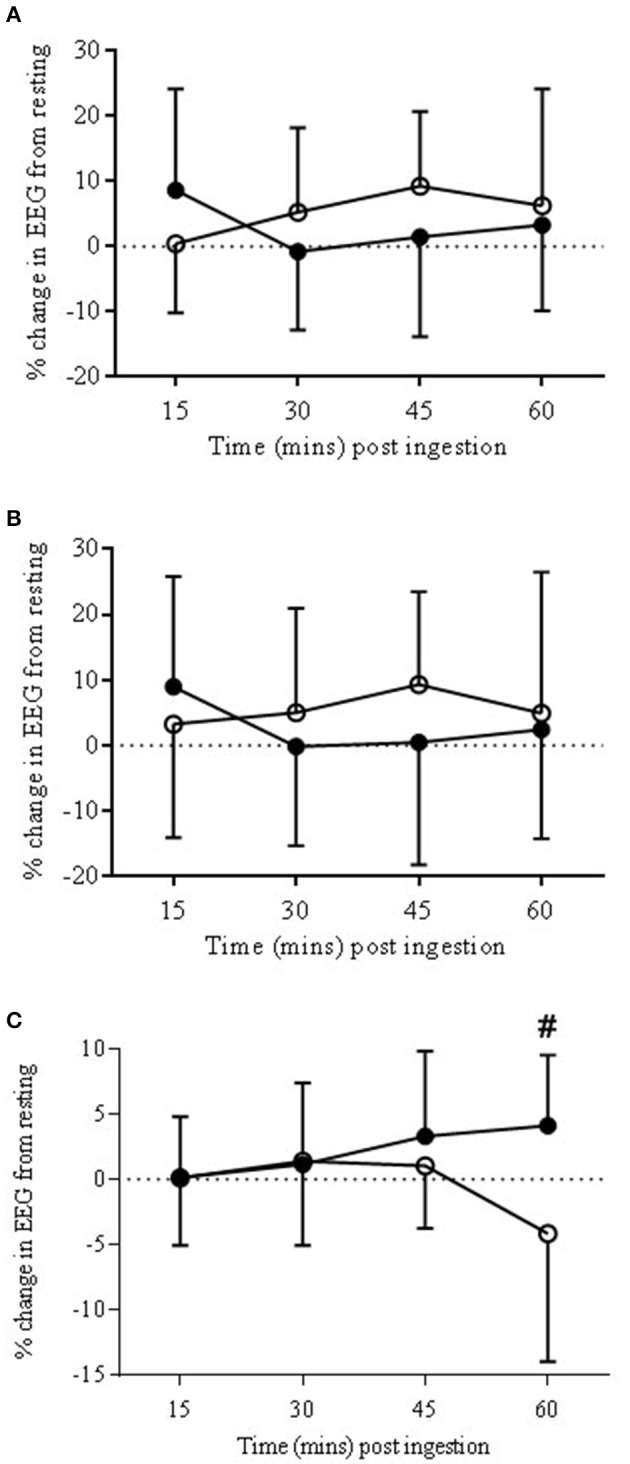
Figure 4.

EEG Gamma bandwidth responses to COR (•) and PLA (o) in ANTPFC (A), VLPFC (B), and MC (C) during rest. Presented as % change from rest (0 min) to 15, 30, 45, and 60 min post-ingestion. There was a trend for percentage change at COR 60 (3.88 ± 5.1%) to be higher than COR 15 (0.14 ± 6.2%) (#P = 0.07).
