
FIGURE 11.
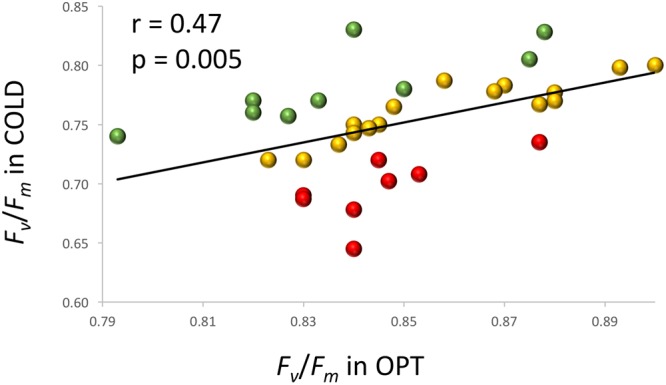
Relationship between Fv/Fm measured on cotyledons of seedlings cultivated in optimal (OPT, x-axis) or low (COLD, y-axis) temperature in plastic boxes (experiment 6). Red color indicates accessions with the largest decrease (≥0.12) in the Fv/Fm values, green color indicates accessions with the lowest decrease (≤0.07) in the Fv/Fm values, and yellow color indicates accessions with the intermediate decrease (0.08–0.11) in the Fv/Fm values. The Fv/Fm values in COLD were significantly (p ≤ 0.05) smaller for all but one accessions.