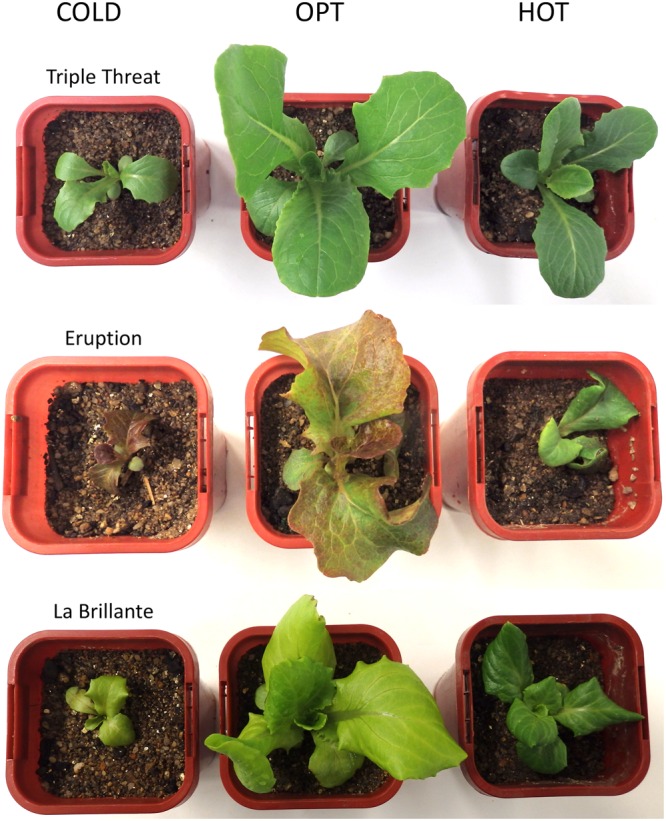
FIGURE 13.

Comparison of the size and the color of plants cultivated at optimal (OPT), low (COLD), and high (HOT) temperatures (experiment 3). Plants were initially grown at OPT for 10 days and then either continuously kept in OPT or transferred to COLD or HOT for 8 days. Sides of the square pots are 68 mm long.
