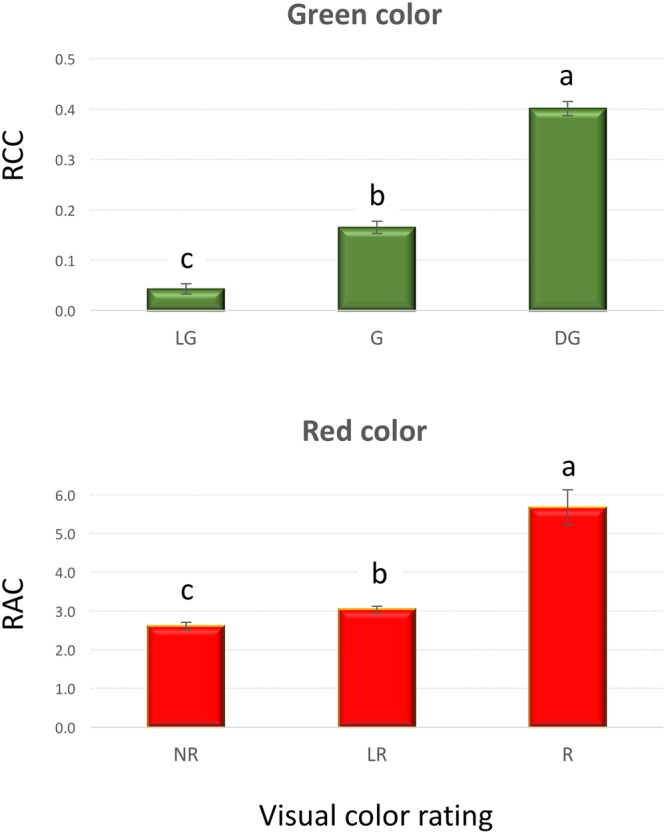
FIGURE 2.

Relative chlorophyll content (RCC) and relative anthocyanin content (RAC) in plants that were visually rated for the intensity of green (top) and red (bottom) leaf color (experiment 1). Vertical bars show standard errors; different letters within each panel indicate means that are significantly different at p < 0.05. Visual color rating scale was: LG – light green, G – green, DG – dark green, NR – no red, LR – light red, and R – red.
