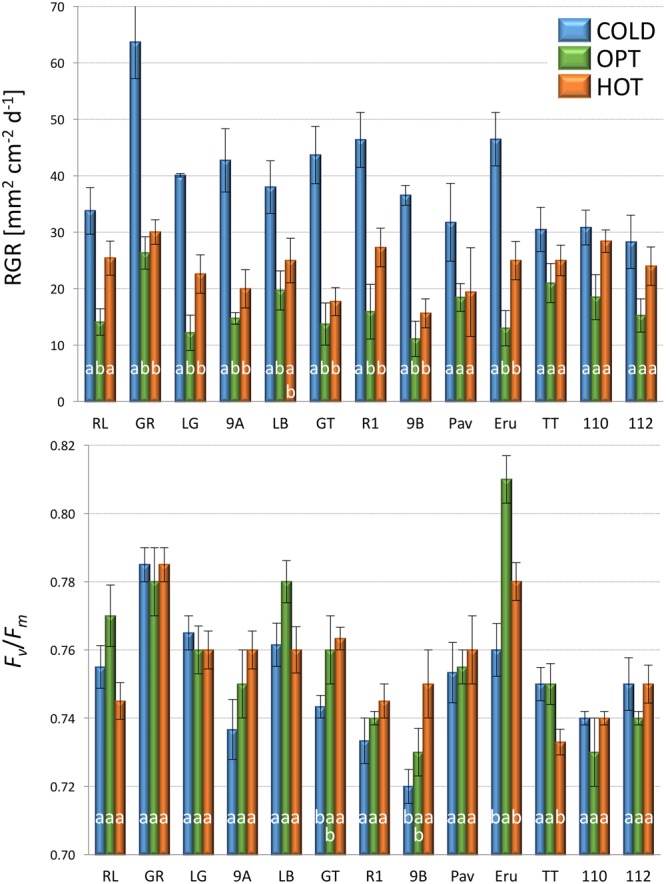
FIGURE 6.

Relative growth rate (RGR, top) and Fv/Fm (bottom) of plants constantly cultivated in optimal (OPT, green color) temperature, or transferred to the optimal temperature after 8 days at low (COLD, blue color) or high (HOT, orange color) temperature (experiment 3). Vertical bars show standard errors (n = 5); different letters within each accession indicate means that are significantly different at p < 0.05.
