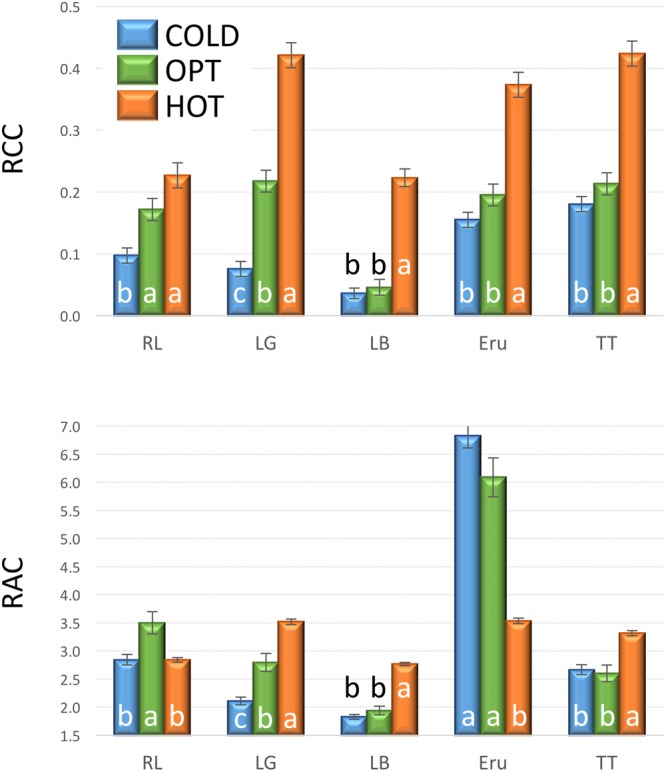
FIGURE 7.

Relative chlorophyll content (RCC, top) and relative anthocyanin content (RAC, bottom) in plants cultivated in optimal (OPT, green color), low (COLD, blue color), or high (HOT, orange color) temperature (experiment 3). Vertical bars show standard errors (n = 5); different letters within each accession indicate means that are significantly different at p < 0.05.
