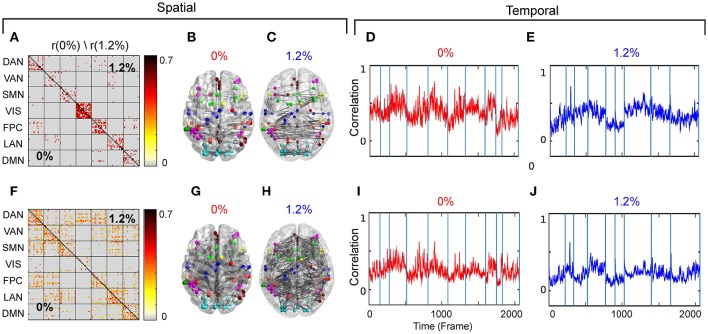
Figure 4.
(A) Second spatial motif for 0 and 1.2%. (B) Second spatial motifs on brain surface with nodes and edges for 0%. (C) Second spatial motifs on brain surface with nodes and edges for 1.2%. Second temporal motif for (D) 0% and (E) 1.2%. (F) Third spatial motif for 0 and 1.2%. (G) Third spatial motifs on brain surface with nodes and edges for 0%. (H) Third spatial motifs on brain surface with nodes and edges for 1.2%. Second temporal motif for (I) 0% and (J) 1.2%. Blue vertical lines in the traces of the temporal motifs denote transitions of data contributed by individual participants.

