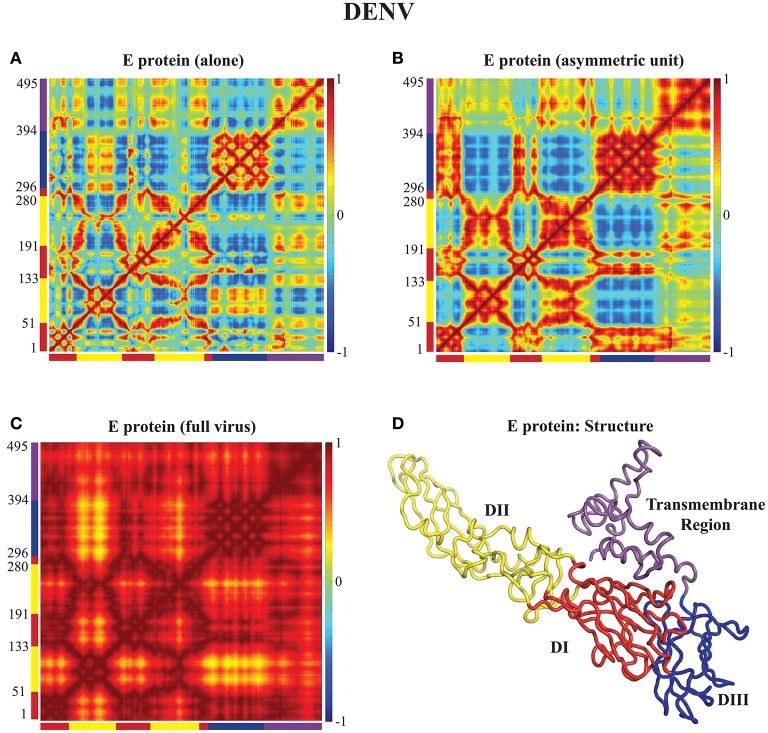
Figure 3.
Correlated motions in the DENV E protein. Cross Correlation Matrices (CCM) obtained from the 94 first non-zero modes for the E protein alone (MONO, A), the E protein in the asymmetric unit (UNIT, B), and the E protein in the whole capsid (FULL, C). Those plot show correlations between the motions of Cα atoms in each complex considered. Both axes of a matrix are the amino acid residue index. Each cell in a matrix shows the correlation between the motions of two residues (Cα atoms) in the protein on a range from −1 (anticorrelated, blue) to 1 (correlated, red), with 0 conferring no correlation. (D) The E protein is shown in cartoon mode. The color code for the structure in (C) as well as for the X and Y axes of the CCM plots in (A) to follows the standard designation of the E protein domains I (red), II (yellow), and III (blue). The transmembrane domain is shown in purple. Panel (D) was generated using Pymol.

