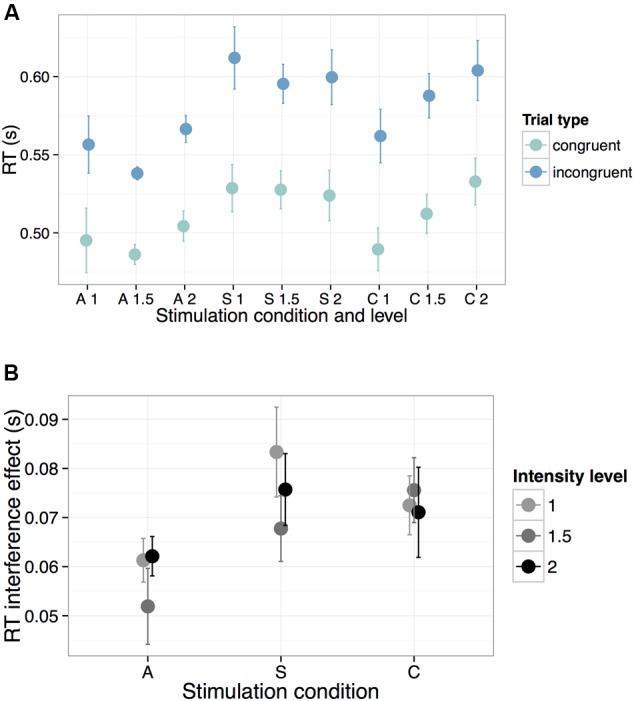
FIGURE 3.

Behavioral performance on the Flanker task across all experimental manipulations (A = Anode, S = Sham, C = Cathode). To illustrate the general speed-up in RTs during A-tDCS, we show in (A) response times across all stimulation parameters for both congruent (teal) and incongruent (blue) trials. In (B), we highlight the reduced interference effect during A-tDCS, plotting the mathematical difference in RTs between the incongruent and congruent trials across all levels of intensity. Error bars represent one standard error of the mean.
