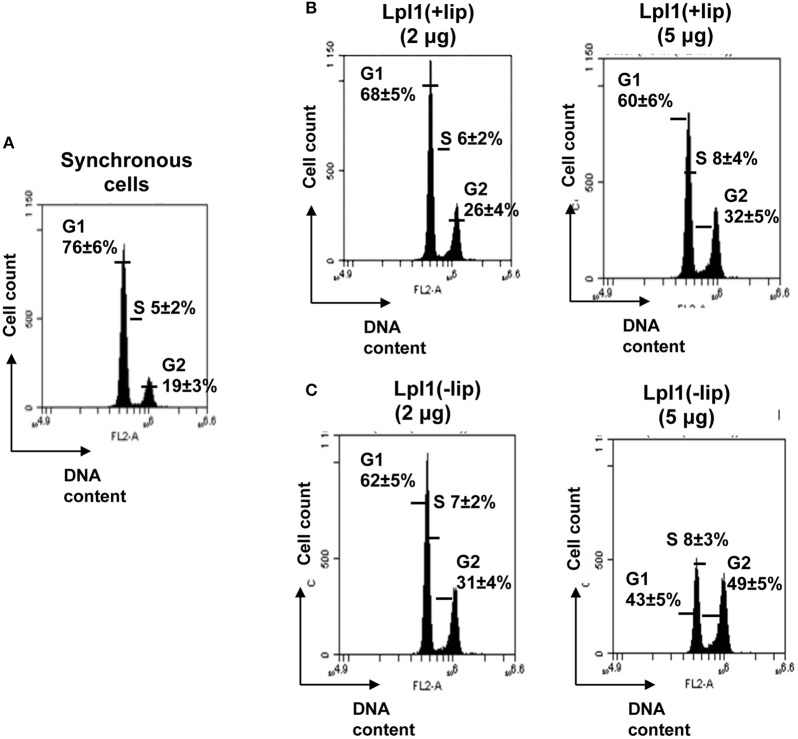
Figure 2.
Effect of Lpl1(+LSP) and Lpl1(−LSP) on HeLa cell cycle. (A) Control experiment: In synchronized HeLa cells after 25 h incubation the distribution (%) of cells in G1 phase was (±76%), in S (±5%), and in G2 (±19%). Effect of 2 and 5 μg/ml of purified (B) Lpl1(+LSP) (68 and 171 nM) and (C) Lpl1(−LSP) (70 and 176 nM) on cell cycle progression. The average percentage of cell cycle phase ±SD is indicated. We show the values of one representative experiment out of four. P-values < 0.05 were considered to be significant.

