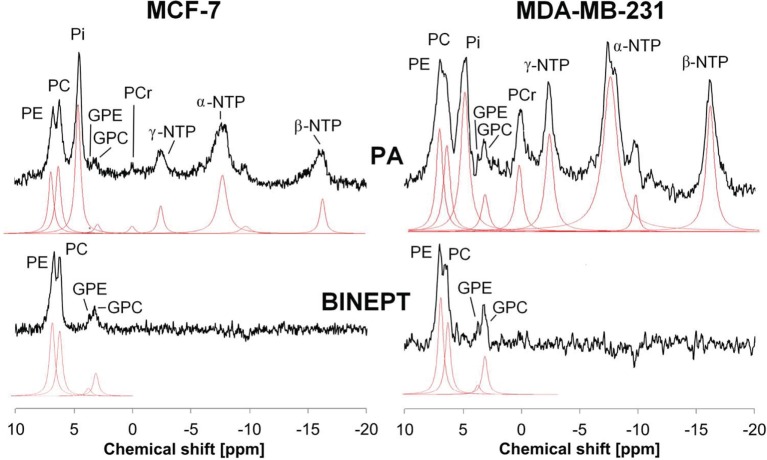
Figure 2.
Example of in vivo pulse-acquire (PA, top) and BINEPT (bottom) 31P MR spectra of a representative MCF-7 (left) and MDA-MB-231 (right) tumor. Lorentzian lines as fitted by the software jMRUI (http://www.jmrui.eu/) are shown below each MR spectrum. All phosphorylated metabolites are visible in the PA spectrum, whereas the BINEPT spectrum only contains signals from phospholipid metabolites with H-P-coupling such as phosphoethanolamine (PE), phosphocholine (PC), glycerophosphoethanolamine (GPE), and glycerophosphocholine (GPC). Note the broad, uneven baseline in the 0–5 ppm region of the PA spectra, where signals from mobile membrane phospholipids are resonating. The signal of β-nucleoside triphosphate (NTP) is formed by β-NTP only. The signal labeled α-NTP is an overlapping signal from α-NTP, α-nucleoside diphosphate (α-NDP), nicotinamide adenine diphosphate, and diphosphodiesters. The signal labeled γ-NTP is an overlapping signal from γ-NTP and β-NDP. Typically, β-NTP is the smallest peak of the three NTP signals; however, here, γ-NTP overlaps with a broad baseline signal that makes it appear smaller than β-NTP. Adapted from Wijnen et al. (44).

