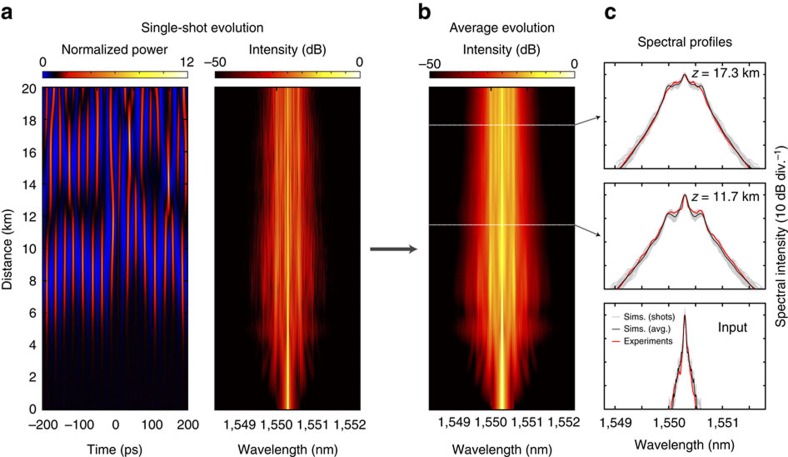
Figure 1. Temporal and spectral evolution of modulation instability.
(a) Single-shot simulations showing temporal and spectral evolution of spontaneous MI. (b) Evolution of the average spectrum calculated from an ensemble of 50 simulations. (c) compares the simulated average spectrum (black) with that measured experimentally (red) at the fibre input and after 11.7 and 17.3 km propagation as indicated. For each case in c, the superimposed grey curves also plot 50 individual realizations from the simulations to illustrate the degree of spectral fluctuation. For the chaotic temporal pulse train, we plot instantaneous pulse power normalized to background  , whilst spectral plots are normalized to the input spectral intensity at 1550.3 nm.

