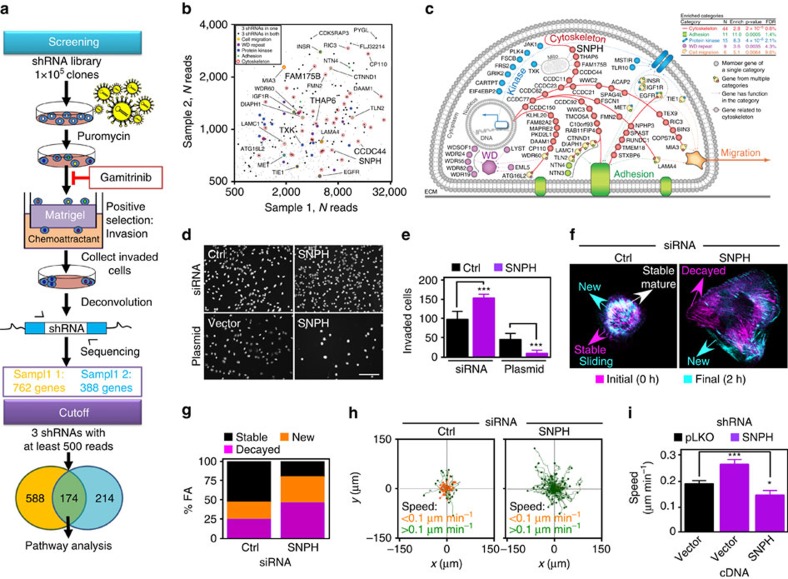
Figure 1. SNPH regulation of tumour cell motility.
(a) Schematic diagram of the genome-wide shRNA screening to identify novel mitochondrial regulators of tumour cell invasion modulated by Gamitrinib. (b,c) Bioinformatics analysis of mitochondrial regulators of tumour cell invasion modulated by Gamitrinib. (d,e) PC3 cells transfected with control siRNA (Ctrl) or SNPH-directed siRNA (top) or vector or SNPH cDNA (bottom) were analysed for invasion across Matrigel-coated inserts. Representative micrographs of DAPI-stained cells (d) and quantification of invaded cells (e). Data are represented as mean±s.e.m. (n=3). ***P=0.0006–<0.0001 by Student's t test. Scale bar, 200 μm. (f) LN229 cells labelled with Talin-RFP and transfected with control (Ctrl) or SNPH-directed siRNA were analysed for FA complex dynamics by time lapse microscopy. Representative merged frames at 0 h (magenta) and 2 h (cyan) are shown. Scale bar, 5 μm. (g) FA complex dynamics in LN229 cells transfected with control siRNA or SNPH-directed siRNA (n=380). (h) LN229 cells were transfected with the indicated siRNAs and analysed for 2D chemotaxis by time-lapse video microscopy. Colour-identified cutoff velocities of cell motility are indicated. Each tracing corresponds to an individual cell. Sample sizes were Ctrl (n=60), SNPH (n=89). (i) shRNA-transduced PC3 cells were reconstituted with vector or SNPH cDNA and analysed for cell motility in a 2D chemotaxis chamber with quantification of speed of cell migration. Data are represented as mean±s.e.m. Sample sizes were: pLKO,Vector (n=46), SNPHsh,Vector (n=48), SNPHsh,SNPHcDNA (n=46). *P=0.0209; ***P=0.0007 by one-way ANOVA and Bonferroni's post-test.

