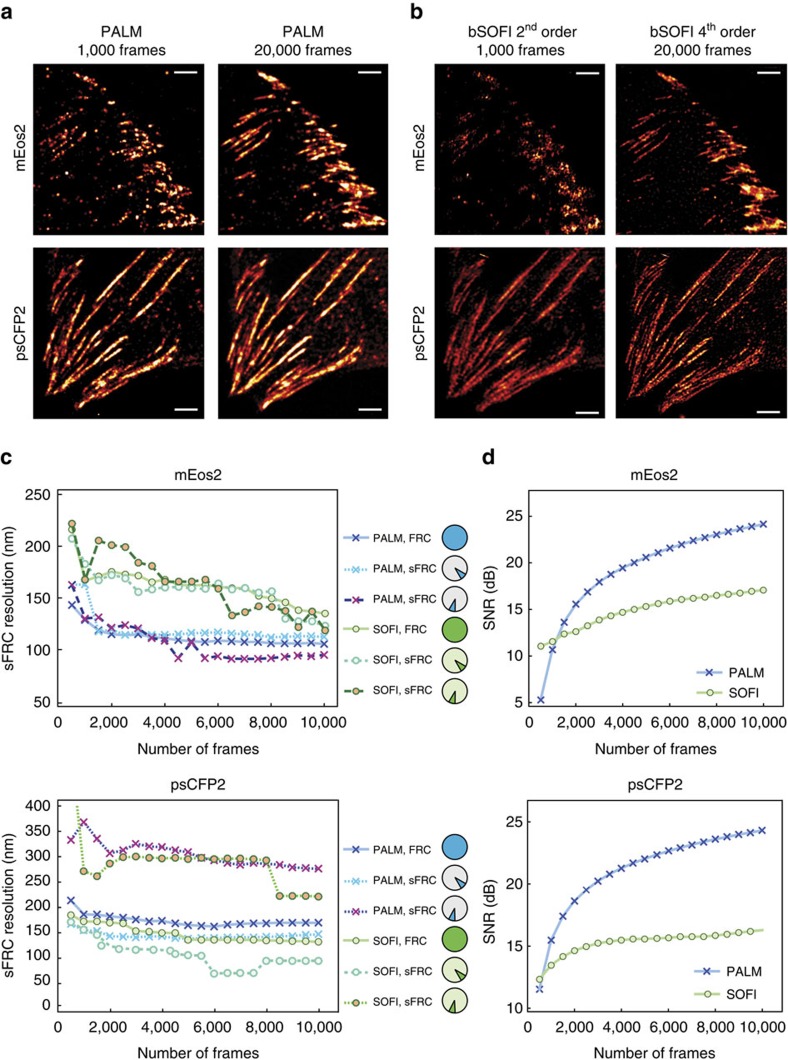
Figure 1. Objective image quality assessment integrating a resolution metric and a SNR metric applied to PALM and SOFI images.
(a) PALM images of fixed MEF cells expressing paxillin labelled with mEos2 or psCFP2, obtained from a full raw image sequence (20,000 frames) and the first 1,000 frames. The PALM images were rendered as probability maps (see Methods). (b) SOFI images obtained from the same raw image sequences as in a. (c) Resolution (sFRC) metric for SOFI and PALM as a function of the number of frames, obtained from subsequences of the same raw image sequences as in a and b. The circles indicate the sector used for the sFRC calculation, the sector with the lowest sFRC values provides the best description of the resolution. Note that the sFRC requires to split the number of frames in two halves to create two images. Therefore, 20,000 input frames allows one to calculate the sFRC corresponding to a super-resolved image reconstructed from 10,000 frames. (d) SNR metric for SOFI and PALM as a function of the number of frames, obtained from subsequences of the same raw image sequences as in a and b. Scale bar, 2 μm.

