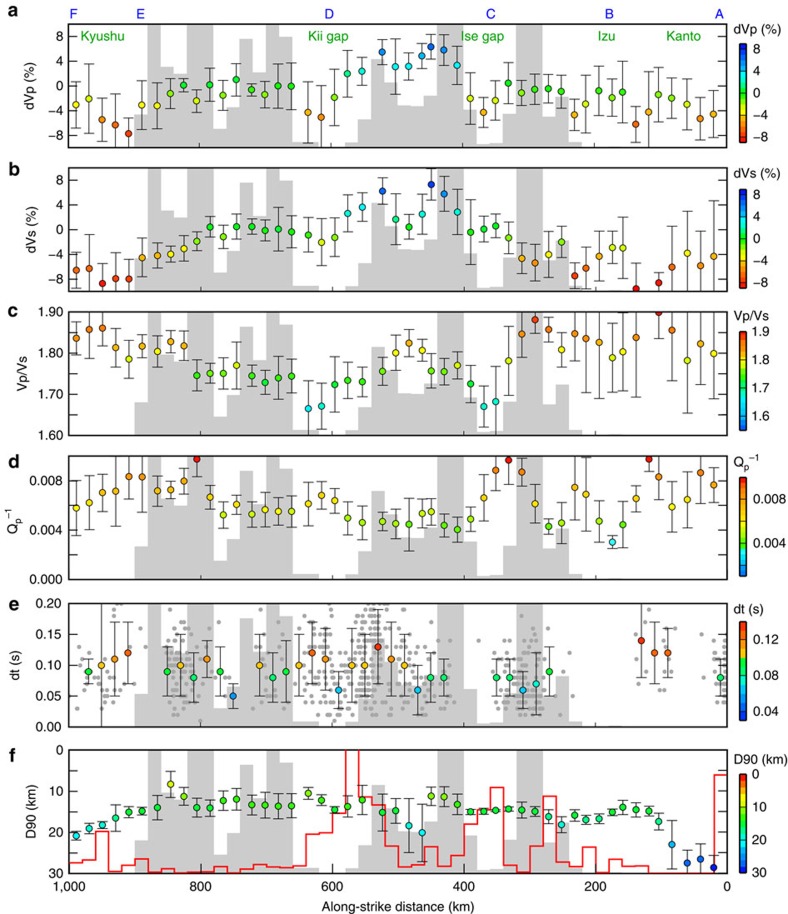
Figure 2. Seismic properties above the megathrust compared with low-frequency earthquake activity.
Along-strike variations in: (a) P-wave velocity perturbations (dVp); (b) S-wave velocity perturbations (dVs); (c) Vp/Vs values; and (d) P-wave attenuation (Qp−1) averaged every ∼20 km over the layer located 1–4 km above the Philippine Sea slab beneath the low-frequency earthquake (LFE) band shown in Fig. 1a; (e) delay times (dt) derived from shear-weave splitting analysis (grey dots denote a delay time measured for each ray path, plotted at the epicentre–station mid-point); and (f) D90 (ref. 18), the depth above which 90% of earthquakes in the overlying plate occur. The grey histogram in each panel denotes the number of LFEs (the maximum frequency of 1,000), and the red histogram in f shows the number of earthquakes (the maximum frequency of 3,000) that occur in the layer located 10–30 km above the Philippine Sea slab. The vertical bars adjacent to each data point in the panels denote one-sigma uncertainties.

