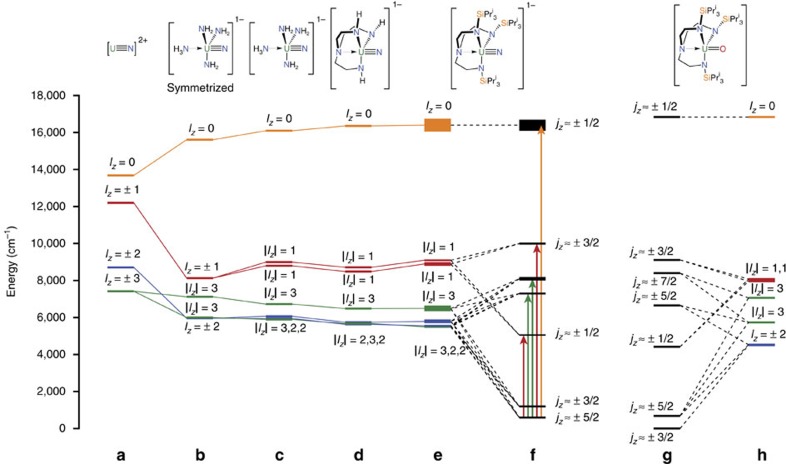
Figure 5. Level diagrams for nitrides and oxide.
5f orbital energy diagram for model uranium(V) complexes from ab initio calculations; (a) [UN]2+, (b) symmetrized [U(NH3)(NH2)3(N)]−, (c) low symmetry [U(NH3)(NH2)3(N)]−, (d) [U(TrenH)(N)]−, (e) average 3M, 4M and 5M of [U(TrenTIPS)(N)]−, (f) average 3M, 4M and 5M of [U(TrenTIPS)(N)]− with SOC, (g) comparative terminal mono(oxo) complex 1 [U(TrenTIPS)(O)] with SOC, and (h) comparative terminal mono(oxo) complex 1 [U(TrenTIPS)(O)]. The thickness of the levels for e,f indicates the s.d. around the average positions across the series 3M, 4M and 5M. Third and fourth excited SO-coupled states for f are not given approximate jz labels, as the composition of these states varies greatly across the series 3M, 4M and 5M. The arrows refer to optical transitions within the jz electronic manifold from ground to excited states and the colour references the orbital lz parentage of the given transition.

