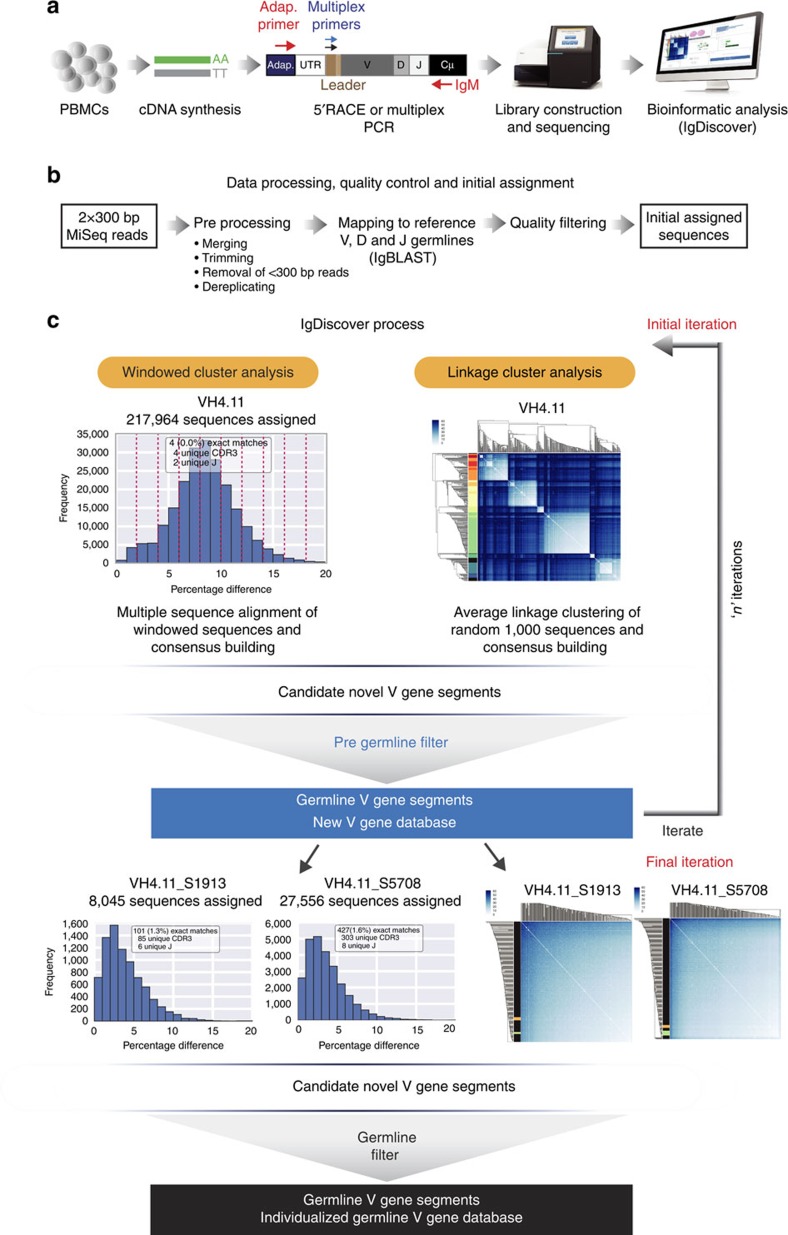
Figure 4. The IgDiscover iterative gene discovery process.
(a) Following isolation of lymphocyte messenger RNA, an IgM library is constructed using either 5′RACE or multiplex PCR and sequenced using the Illumina MiSeq system. (b) Paired sequences are merged, and adapters are optionally removed. IgBLAST then assigns VH segments based on the starting database, and low-quality assignments are filtered (see Methods). (c) Windowed cluster analysis, (upper left panel), showing sequences assigned to a reference gene and binned in 2% windows to allow discrete consensus building. Linkage cluster analysis (upper right panel) of a subset of 300 sequences. Rows and columns of the matrix correspond to sequences. The colour at an intersection of a row and a column gives the number of differences between the corresponding sequences. The dendrograms (to the left and above, both identical) show the hierarchy found according to hierarchical clustering. Sequences are rearranged to conform to the clustering, putting similar sequences adjacent to each other. Clusters of similar sequences are visible as bright squares along the main diagonal. Colouring on the left indicates clusters detected by IgDiscover (one colour per cluster). Following consensus building, candidate germline sequences are processed using the pregermline filter, resulting in a new VH database. The assignment, clustering, consensus-building and pregermline filter steps are repeated for a set number of iterations using each new VH database for initial assignment. Examples of windowed cluster histograms (left two lower panels) and linkage cluster plots (right two lower panels) using databases containing newly identified candidate germline V genes. In the final iteration, the candidate V genes are processed using the germline filter to reveal the final database.

