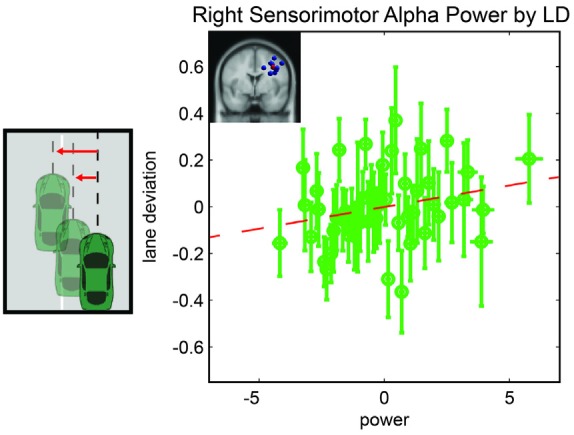
Figure 3.

Resampled data to reflect the relationship between LD and alpha power. Since subjects had variable numbers of trials, we resampled to 50 trials for each subject. Each point represents the mean across a single resampled trial for all 10 subjects and error bars reflect the standard error of the mean. This was done strictly for visualization purposes the data were not resampled for our statistical analyses. The best fit line is superimposed in red.
