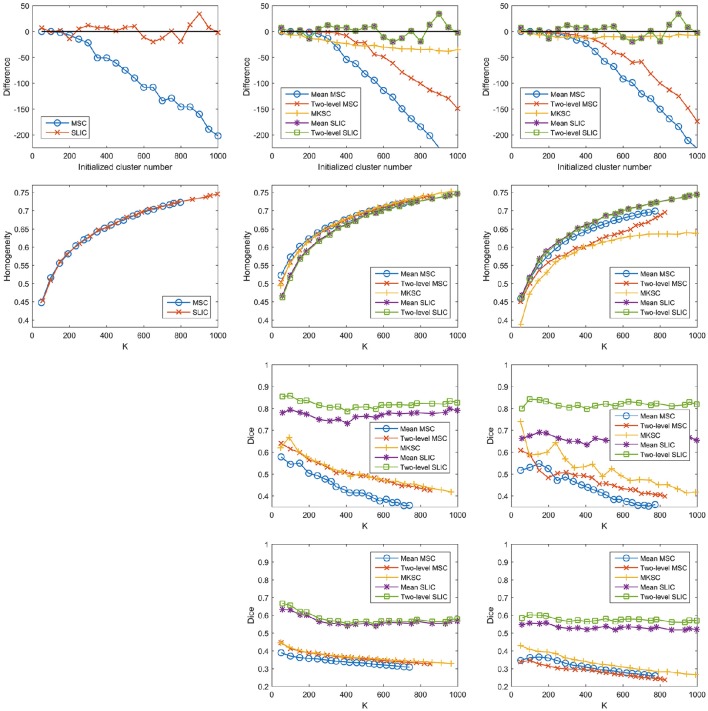
Figure 12.
The results of different evaluation metrics of the five parcellation approaches and the three sparsifying schemes when the weighting function is set to be a constant value one. The four rows correspond to the difference between the actual cluster number and the initialized cluster number, the functional homogeneity, the group-to-group reproducibility, and the group-to-subject reproducibility in order. The three columns correspond to SS1, SS2, and SS3 in order.

