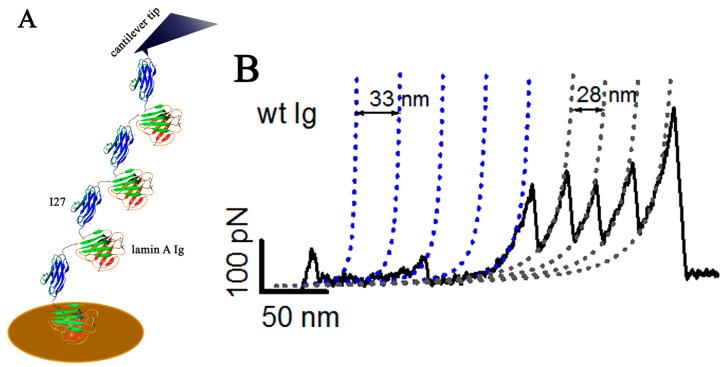
Figure 1.
Schematic diagram of stretching of the Ig-fold domain in single molecule force spectroscopy (SMFS) and the force-extension curve. (A) Illustration showing the construct of alternating units of Ig and I27, which are pulled by a cantilever tip from the gold coated cover slip containing a drop of the protein; (B) Force extension curves plotting the unfolding force and change in contour length. The curve is fitted with a worm-like chain model of polymer elasticity. (Reproduced with permission from Bera et. al, Biochemistry, 2014).

