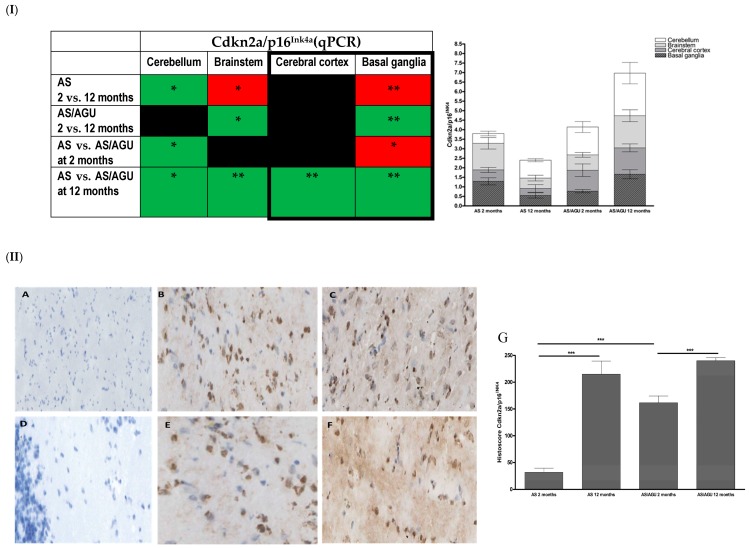
Figure 2.
Age-related differences in Cdkn2a/p16Ink4a expression in the brains of AS and AS/AGU rats. (I) Cdkn2a/p16 expression measured using qPCR. (I) Directionality of transcriptional changes denoted as colours (green-increase and red decrease in relative gene expression). Black colour denotes lack of significant changes in the gene expression. Regions of the brain linked to Parkinson’s disease are bolded for easier comparison). Stacked bar chart represents mean RQ Cdkn2a/p16Ink4 with SEM for each individual brain region in both rat strains at the two time points. Each bar represents the mean with SEM for an individual category. (II) Immunohistochemical staining and total histoscore for p16Ink4a protein expression (brown precipitate) in para-sagittal brain sections collected from two month and 12 month old AS and AS/AGU rats. A: negative control (AS at 12 months old). B: Two month old AS. C: Twelve month old AS. D: Negative control (AS/AGU at two months old). E: Two month old AS/AGU. F: Twelve month old AS/AGU. G: Corresponding histoscores for p16Ink4a expression in 12 month old AS and AS/AGU rats. Significance: * p < 0.05, ** p < 0.01, *** p < 0.001.

