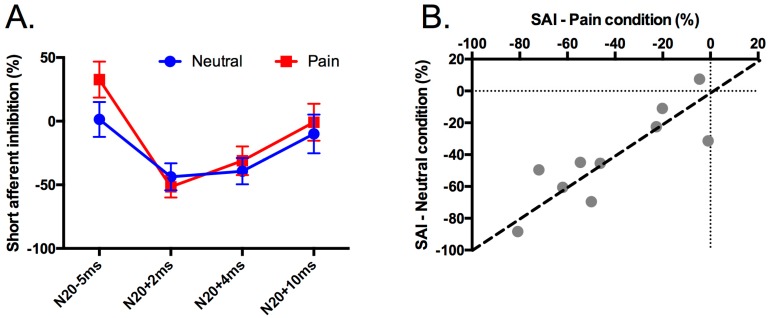
Figure 4.
Percentage change in MEP amplitude. (A) The amount of SAI (percentage change in MEP amplitude) separately for each ISI for the NEUTRAL (Blue) and PAIN (Red) conditions. (B) The average amount of SAI at N20+2 and N20+4 in the NEUTRAL condition versus the PAIN condition. These two ISIs were averaged because they were significantly different from MEPtest (see [20] for a similar approach).

