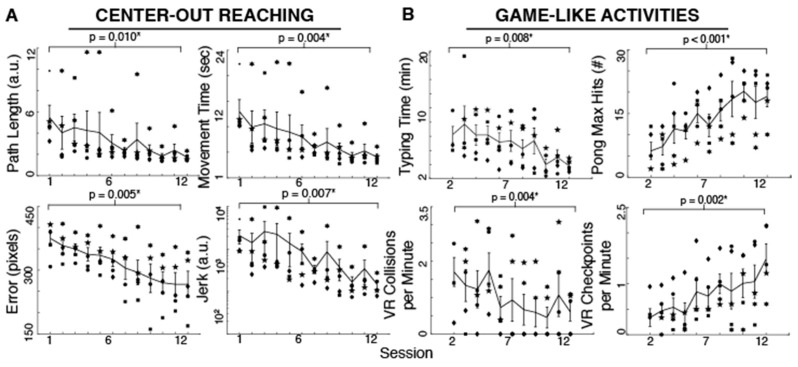
Figure 2.
Spinal cord injured participant performance during 12 sessions of body-machine interface (BMI) computer tasks. (A) Individual subjects’ mean performance at each session is shown by a unique marker type. The lines represent the group averages (n = 5 participants, 48 trials per session) ±SEM (bars); (B) Participant’s performance during typing, Pong and virtual reality wheelchair driving. Horizontal lines on top of each graph represent the results for the one-sided paired t-test comparing the first to the last session. A star indicates a significant difference at p < 0.05.

