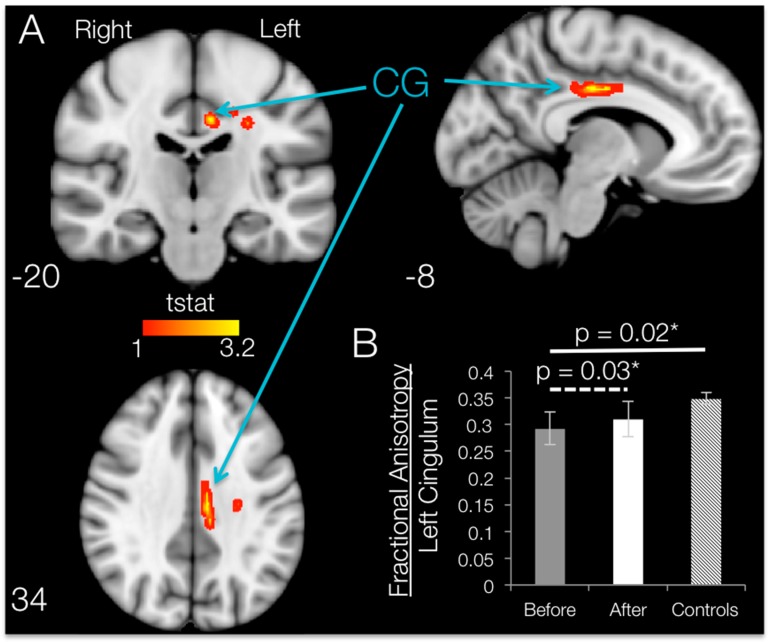
Figure 6.
Regions showing increases in FA in SCI subjects after 12 weeks of BMI training. (A) Regions showing significantly higher FA (p < 0.05, uncorrected) in SCI subjects after BMI training overlaid over the standard MNI152 T1-weighted anatomical scan. The regions are thickened for visualization purposes only. The location of each slice in Montreal Neurological Institute space is shown at the lower left section. CG, cingulum; (B) FA of left cingulum before and after training for SCI subjects (dotted line, paired-sample t-test) and controls (solid line, two-sample t-test). Bars are the means ± SEM.

