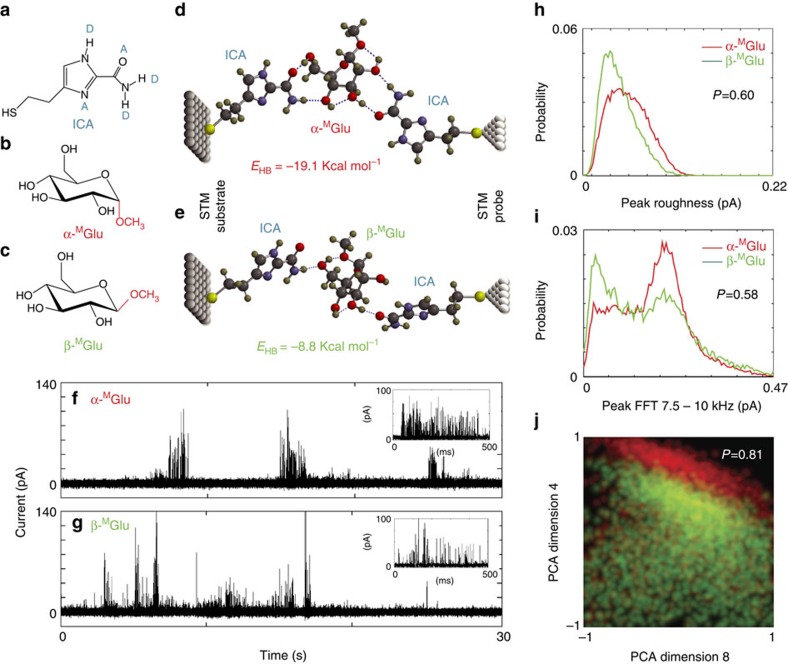
Figure 1. Recognition tunnelling analysis of anomers of methyl D-glucopyranoside.
(a) The recognition molecule ICA bearing a thiol linkage for bonding to metal electrodes, as well as a number of hydrogen bonding donors (D) and acceptors (A), through which a large range of analytes can be captured by a diversity of spatial arrangements resulting from tautomerism and rotation about σ-bonds; (b) Structure of α-MGlu and (c) Structure of β-MGlu, both of which can form hydrogen-bonded triplets with ICA molecules spanning a tunnel gap of 2.2 nm, as shown by computer simulations in d,e. Evidence of these complexes is provided by the current-spikes that appear only after an analyte solution is added to pure buffer solution in a tunnel gap (f,g). Distributions of signal features are broad and overlapped (red=α-MGlu, green=β-MGlu) as shown here for the peak roughness (s.d. of points above half maximum current) h and one frequency band in the Fourier transform of each peak (peak FFT 7.5–10 kHz, i) Data can be assigned to one analyte or the other with a probability (0.6, 0.58) only marginally above random, 0.5 (see Methods for details of the signal analysis). However, when the frequency with which multiple parameter values occur together is plotted (j) the accuracy with which data can be assigned increases to 80%. The plot shows the distribution of the simultaneous occurrence of two principle components, vectors composed of multiple parameter values as described in Supplementary Methods. When the distribution of parameter values is constructed in higher dimensions, separation increases to ∼99%. This accuracy can be improved to ∼99% using additional signal features. Colours in j are mixed so that overlapped points are yellow.

