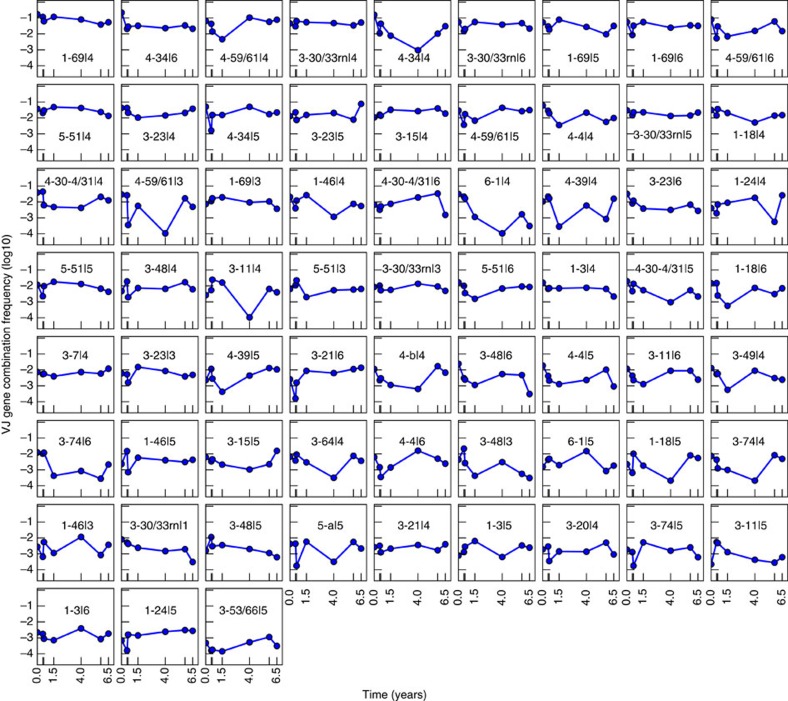
Figure 3. Frequencies of gene combinations among BM plasma cells are temporally stable.
IGH V-J usage frequencies for Donor 1 are shown. Plots are sorted by decreasing mean frequency. Only gene identifications that appear in all time points are shown. See Supplementary Fig. 1a–c for usage frequencies of IGH V-D, D-J and V-D-J.

