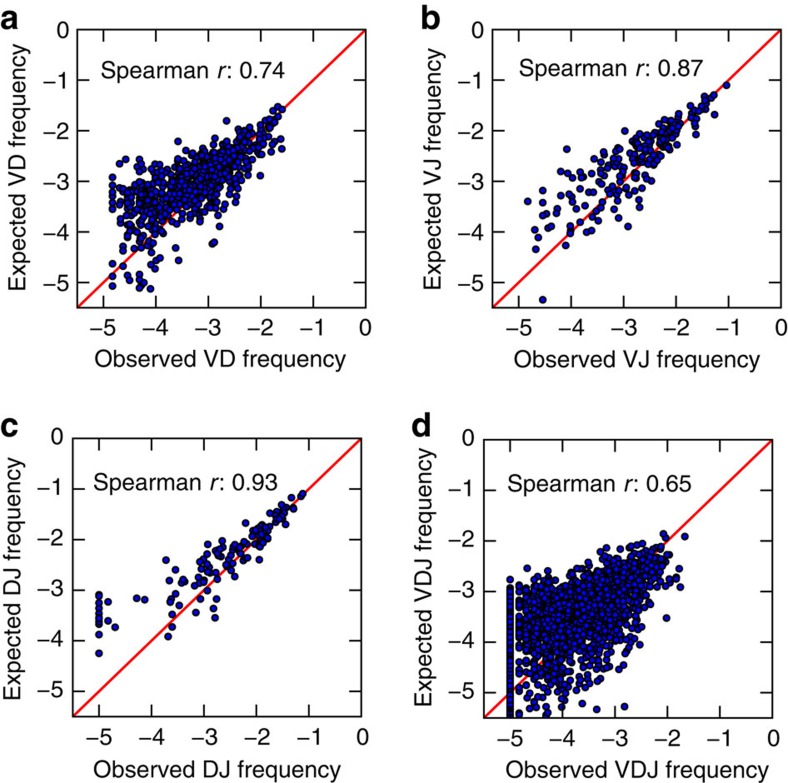
Figure 4. Gene combinations among BM plasma cells do not preferentially associate.
Gene combinations are randomly assorted in Donor 1. (a–d) Spearman's rank correlation of expected versus observed IGH V-D (a), V-J (b), D-J (c) and V-D-J (d) gene combination frequencies. Expected (by random association) frequencies are calculated as products of the frequencies of the individual component genes. Diagonal lines in red indicate no difference between the expected and observed frequencies.

