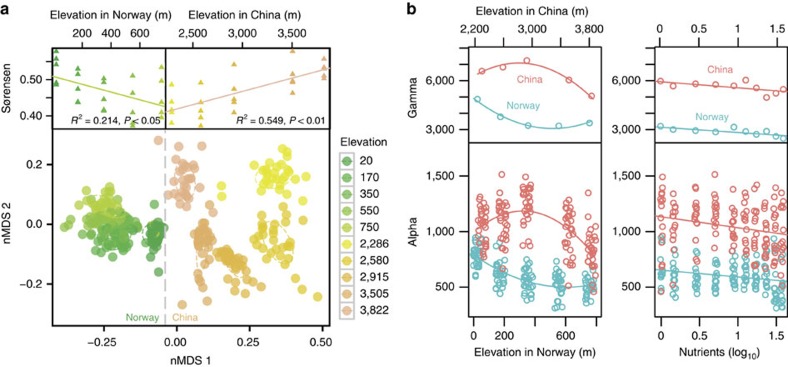
Figure 2. Responses of community composition and diversity to elevation and nutrients.
(a) Non-metric multidimensional scaling (nMDS) plot of bacterial communities (lower panel), grouped by elevation (m a.s.l., indicated by colour, with higher elevations in warmer colours) and country (indicated by dotted grey line). This plot illustrates that the communities at lower elevations in Norway (or higher elevations in China) were more similar to communities in China (or Norway) than the communities at higher elevations in Norway (or lower elevations in China), which is quantitatively supported by the upper figure panels (left: Norway; right: China) that have triangle points and linear regression lines. We calculated the community Sørensen similarity along the elevational gradient between each elevation of one region (that is, China) and all elevations of the other region (that is, Norway). The relationship between the similarity and elevation was fit and tested with a linear model and permutation tests in the R package lmPerm (v.1.1-2). (b) Gamma diversity (upper panels) and alpha diversity (lower panels) along elevations (left panels) and nutrient enrichment levels (right panels). For diversity-elevation and diversity-nutrient relationships, we applied quadratic and linear models, respectively, and significances of the relationships were examined with F-statistics. For gamma diversity-elevation relationships in Norway and China, the adjusted R2 values were 0.952 (P=0.024) and 0.957 (P=0.022), respectively. For alpha diversity-elevation relationships in Norway and China, the adjusted R2 values were 0.518 (P<0.001) and 0.335 (P<0.001), respectively. For gamma diversity-nutrient relationships in Norway and China, the adjusted R2 values were 0.546 (P=0.009) and 0.332 (P=0.047), respectively. For alpha diversity-nutrient relationships in Norway and China, the adjusted R2 values were 0.047 (P=0.005) and 0.049 (P=0.004), respectively. The elevations (m a.s.l.) in Norway (blue) and China (red) are shown along the bottom and top axes (b, left panels), respectively. The amount of NO3− (mg N l−1) initially added to the microcosms represents the nutrient enrichment (b, right panels). The points were jittered for better visualization (b, lower panels).

