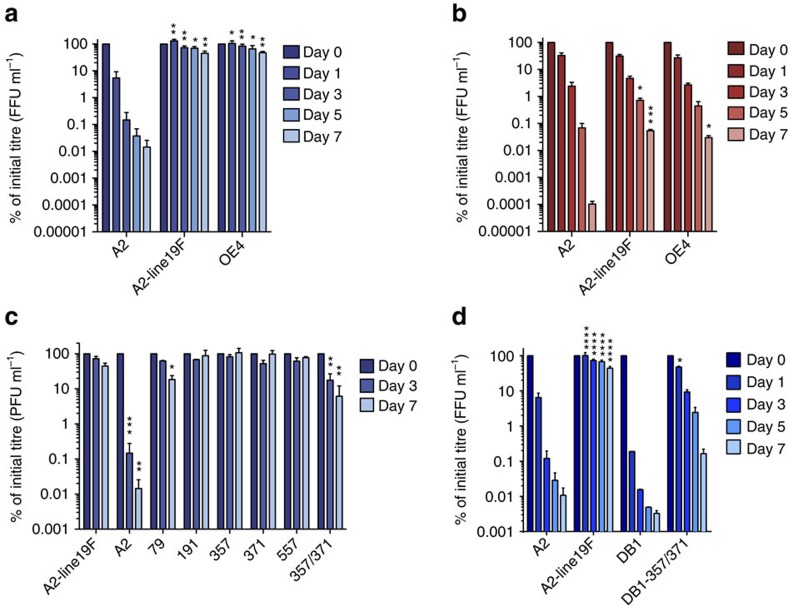
Figure 2. Thermal stability assays.
Thermal inactivation was carried out either by incubation of virus at 4 °C (a,c,d) or 37 °C (b). The viruses in c labelled 79, 191, 357, 371, 557 and 357/371 represent A2-line19F containing substitutions at these indicated positions with A2 residues. The virus in c labelled DB1-357/371 represents DB1 with substitutions of line 19F residues at positions 357 and 371. Viruses were harvested at the indicated time points and titrated by FFU or PFU assays. All graphs represent the means+s.d.'s of at least two experimental replicates combined, and data were analysed by two-way ANOVA (*P<0.05; **P<0.005; ***P<0.0005; ****P<0.00005).

