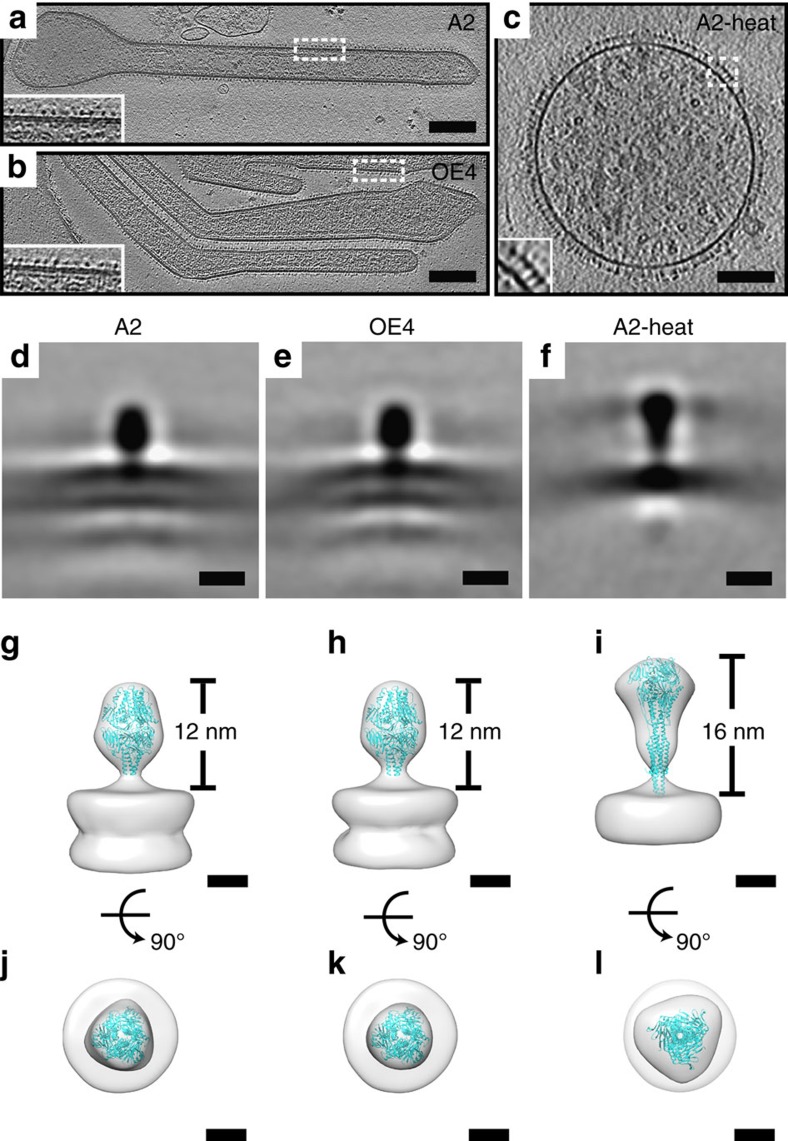
Figure 5. Cryo-electron tomography of RSV virions and subvolume averaging of the F glycoprotein.
(a–c) Tomographic slices (6.14 nm) of A2, OE4 and A2-heat (55 °C for 30 min) virions showing overall virus structure and the organization of surface glycoproteins (insets). Inset in OE4 is rotated 180°. Scale bars are 200 nm for A2 and OE4, and 100 nm for A2-heat. (d–l) Subvolume averages and modelling of RSV F structures in pre- and post-fusion conformations. Central slices (6.14 Å in thickness) of the averaged structures lowpass filtered to 40 Å for A2 (d), OE4 (e) and A2-heat (f). Quasi-atomic models generated by fitting the RSV pre-fusion F (PDB ID 4JHW) and RSV post-fusion F (PDB ID 3RRT) crystal structures into the subvolume averages, with side views (g–i) and top views (j–l) for A2 (g,j), OE4 (h,k) and A2-heat (i,l). Note the height difference between the ectodomain of A2/OE4 and A2-heat. The measurements were made from the top of the membrane to the top of the head domain. Scale bars, 10 nm (d–f); 5 nm (g–l).

