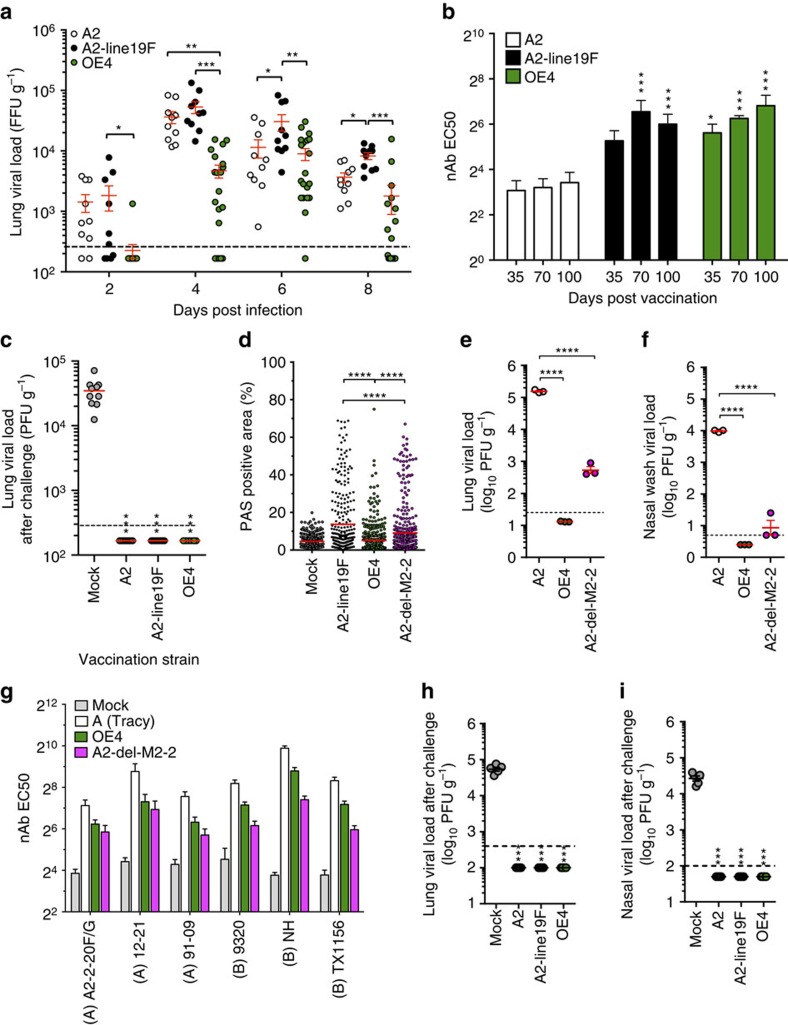
Figure 7. Attenuation and efficacy of OE4 in mice and cotton rats.
(a) Lung viral loads were determined in mice inoculated i.n. with 106 FFU of A2, A2-line19F or OE4 at the indicated time points. (b) Serum nAb titres were measured in mice inoculated with 106 FFU of A2, A2-line19F or OE4. (c) Mice were inoculated with 106 FFU of A2, A2-line19F or OE4 then challenged with 105 PFU of A2-line19F on day 102. Lung viral loads were determined day 4 post challenge. (a–c) Graphs represent combined data from two experiments of 5–10 mice per group. (d) Mice (five per group) were inoculated with mock, A2-line19F, OE4 or A2-del-M2-2, and lungs were harvested 8 days post inoculation for histological quantification of airway mucin expression. Each dot represents an airway, and graph shows >300 airways per group in one of two experiments with similar results. (e,f) Viral load on day 4 in cotton rat lung homogenates (n=3) (e) and nasal washes (n=3) (f) following i.n. inoculation with 105 FFU of A2, OE4 or A2-del-M2-2. (g) Cotton rats (six per group) were inoculated with mock, RSV A(Tracy), OE4 or A2-del-M2-2, and serum nAb titres against representative RSV strains were determined on day 42 post inoculation using pooled sera. EC50 was calculated by non-linear regression, and data represent EC50+upper limit of the 95% confidence interval. (h,i) Cotton rats (five per group) were inoculated with mock, A2, or OE4, challenged on day 42 with 106 FFU of RSV A2-line19F, and viral loads on day 46 were measured in nasal washes (i) and lung lavages (h). *P<0.05; **P<0.005; ***P<0.0005; ****P<0.00005 by one-way (c–f,h,i) or two-way (a,b) ANOVA.

