Figure 3.

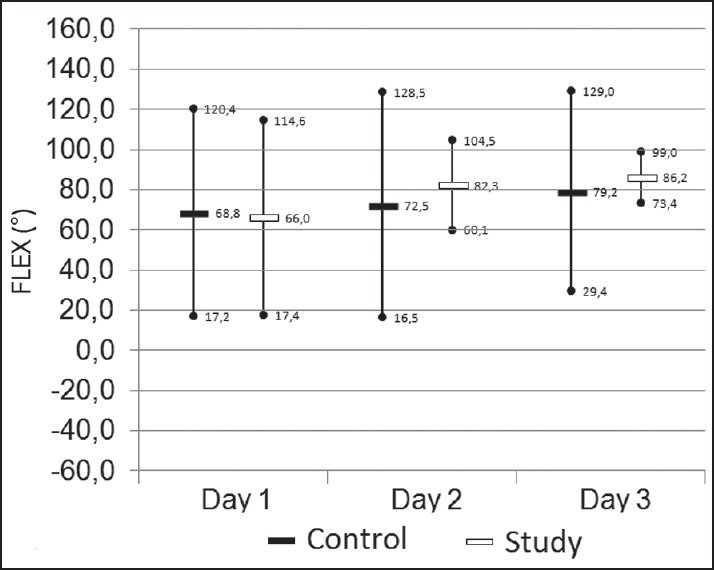
The knee flexion (degrees) on day one to three. Mean values with 95% confidence intervals. The results are for the patients in the control group (black bars), for the study group (white bars).

The knee flexion (degrees) on day one to three. Mean values with 95% confidence intervals. The results are for the patients in the control group (black bars), for the study group (white bars).