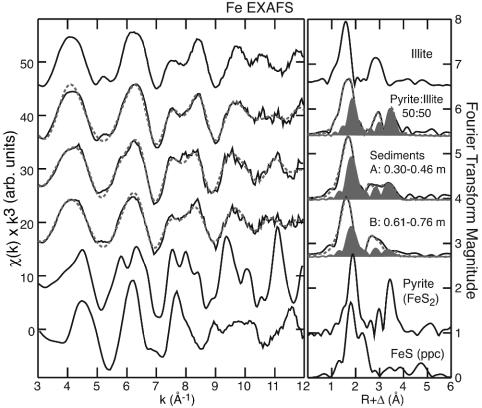
Fig. 2.
Iron K-edge EXAFS spectra. EXAFS spectra and corresponding Fourier transforms for sediment samples A and B compared with reference pyrite, freshly precipitated FeS and illite (see ref. 41 for quantitative fits), and a mechanical mixture of pyrite plus illite (50:50 wt % Fe). Solid lines are data, dashed lines are nonlinear least-squares fits, and the shaded areas indicate the fraction of the fit that is composed of pyrite (sulfide component). The nonsulfide component of the sediments is a composite of iron-bearing phyllosilicate and oxide phases (see Table 3 for numerical fit results).

