Fig. 1.
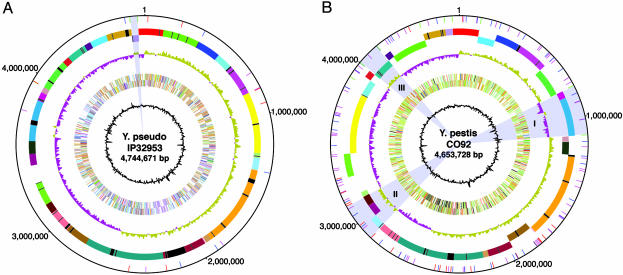
Circular genome map of IP32953 and comparison with Y. pestis CO92. (A) Genome of IP32953. (B) Genome of CO92. (A and B) Circle 1 (from center outward), G+C content; circles 2 and 3, all genes coded by function (forward and reverse strand); circle 4, GC skew (G–C/G+C); circles 5 and 6, genome divided into locally colinear blocks (when IP32953 and CO92 are compared with one another); each block is distinguished by a unique color (black segments within colored blocks represent regions specific to that genome in the comparison), and the orientation of each block is indicated by strand; [circle 5, –ve strand; circle 6, +ve strand); circle 7, locations of IS elements (IS100 is blue, IS285 is red, IS1661 is green, and IS1541 is magenta)]. In A, the gray highlighted region near the 12 o'clock position indicates the proposed IP32953 inversion (see text), whereas the remainder of the genome denotes the stable “ancestral” arrangement that has prevailed through the present. B illustrates the complexity of the molecular events that gave rise to the inversions or translocations in the Y. pestis genome first proposed (16) solely on the basis of the dramatic shifts in G/C skew (gray highlights serotypes I, II, and III), but now extended through whole-genome comparison. For example, gray highlight II is composed of three distinct blocks, two that are derived from distinct places within the same replichore (origin to terminus half), whereas the third block originated from the other replichore (light blue block).

