Fig. 1.
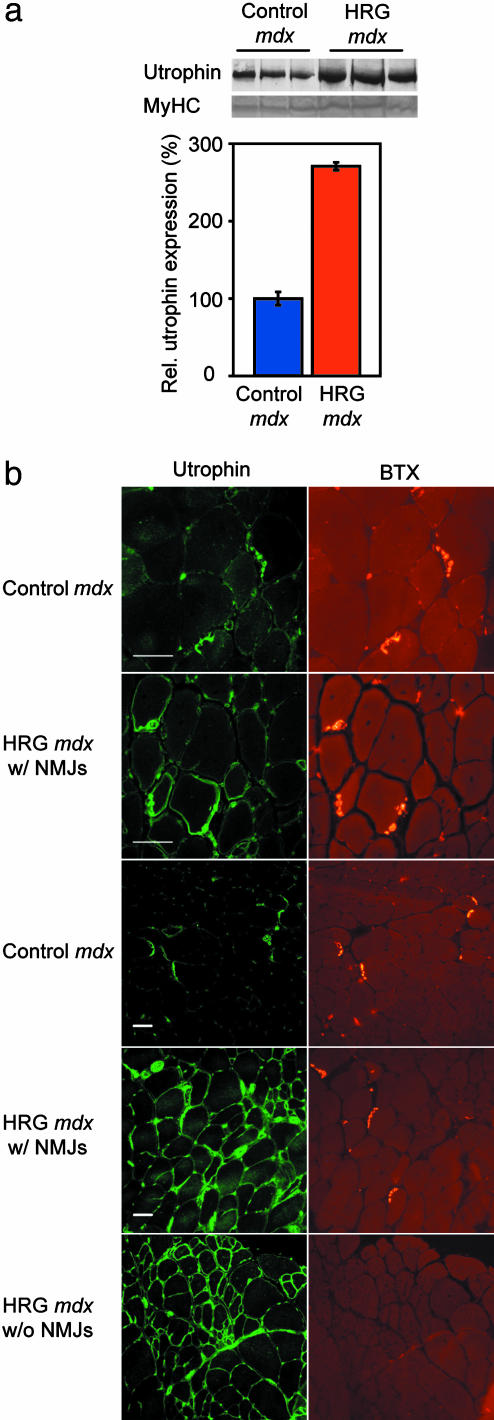
Increased utrophin expression in HRG-treated mdx mice. (a) Utrophin levels in blots of three control and three HRG-treated mdx mice (Upper). (Lower) Myosin heavy chain (MyHC) controls for even loading. Quantification revealed an ≈2.7-fold increase in utrophin in HRG-treated muscle (n = 6; P < 0.005). (b) First and second row from top show a synaptic region from control mdx and HRG-treated TA, respectively, at a ×40 magnification. Third and fourth rows are similar to the first and second rows, but at a ×20 magnification. The fifth row shows an extrasynaptic region of HRG-treated mdx.(Left) Utrophin labeling (BH11 Ab) for NMJs. (Right) Bungarotoxin (BTX) labeling for NMJs. Muscle shows increased sarcolemmal utrophin in the HRG-treated mdx compared to the untreated mdx, where utrophin, within the myofiber, remains restricted to the NMJ region. Labeling of peripheral nerve and vascular utrophin is visible in all panels as well. (Scale bar, 50 μm.)

