
Figure 2.
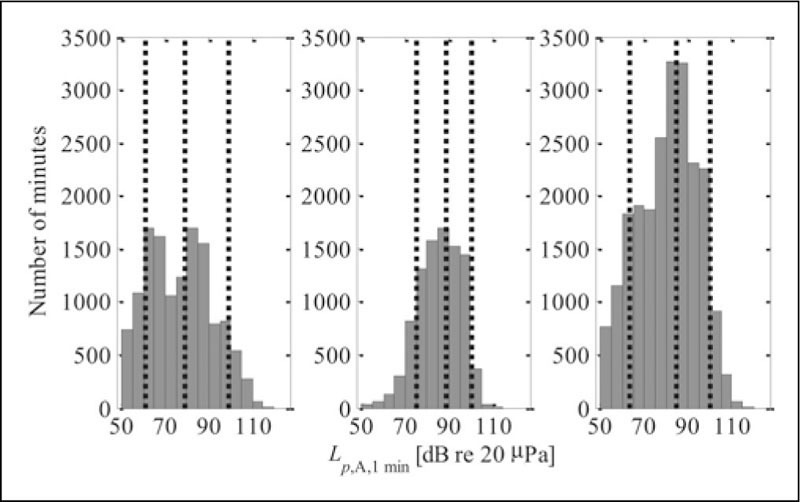
Distribution of 1-min equivalent sound pressure levels during the festivals. The dotted lines in each plot correspond to L90, L50, and L10 from left to right. Left: Hove festival. Middle: Øya festival. Right: Both festivals
Official websites use .gov
A
.gov website belongs to an official
government organization in the United States.
Secure .gov websites use HTTPS
A lock (
) or https:// means you've safely
connected to the .gov website. Share sensitive
information only on official, secure websites.
Distribution of 1-min equivalent sound pressure levels during the festivals. The dotted lines in each plot correspond to L90, L50, and L10 from left to right. Left: Hove festival. Middle: Øya festival. Right: Both festivals