
Figure 5.
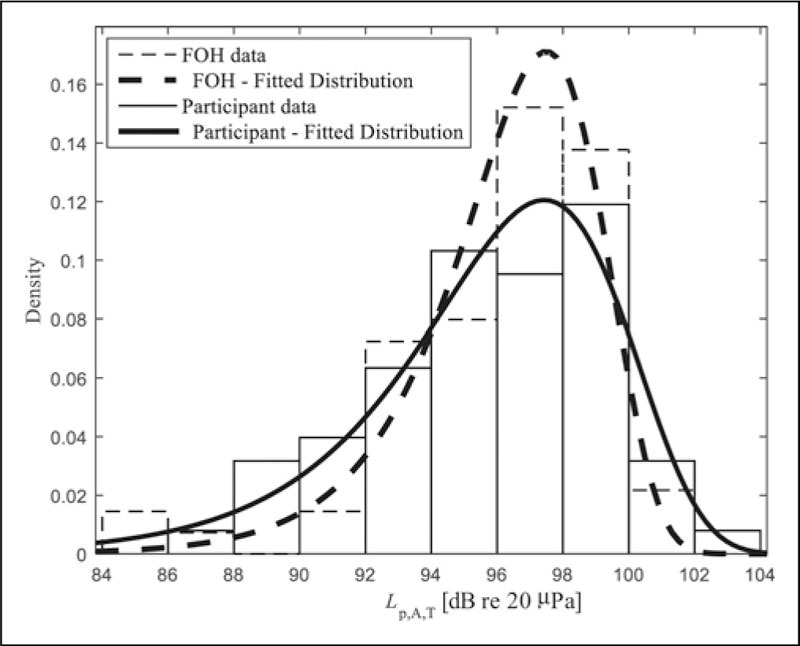
Distribution of equivalent sound pressure levels at the concerts at Øya measured at the front-of-house (FOH) and with the participants. The individual concert length has been used in the calculation of the equivalent levels. Each data set was fitted to an extreme value distribution. FOH data: location=97.5 dB, scale=2.15 dB. Participant data: location=97.4 dB, scale=3.05 dB