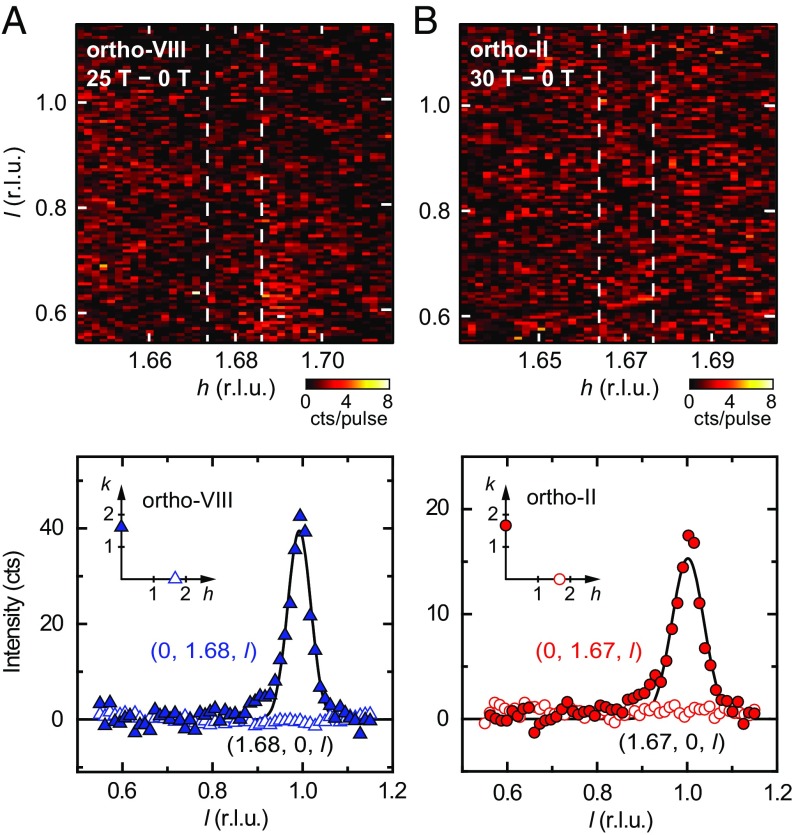
Fig. 4.
Unidirectional character of the 3D CDW. Zero-field-background subtracted diffraction intensity maps of ortho-VIII (A) and ortho-II (B) in high magnetic fields and in the hl-reciprocal plane (Upper). (Lower) The projected intensities along () (blue open triangles) and () (blue closed triangles) in ortho-VIII and () (red open circles) and () (red closed circles) in ortho-II. The projected intensity is obtained by integrating the signal within the window indicated by the dashed lines in A and B, Upper and Fig. 1C. Solid lines are Gaussian fits to the data.

